Oct 12, 2008: Kaboom, now what?
Highlights:The Fall of 2008 crash One for the record books What history tells us?
The Fall of 2008 crash
No, I didn't expect the recent crash, and yes, it hurts. This time, having fallen less than the S&P500 doesn't make me warm and fuzzy at all. The only consolation right now is that this has been a heck of a lesson.I'm not yet sure if there was an easy way to see this kind of crash coming. What was obvious is that during bear markets when all the major long term trends (200, 100 moving averages on all broad indexes) are down, one should be more hedged, and always expecting the unexpected.
The question is what to do now?
One thing that is almost certain, based on all the data I have, is that unless this is the end of the world, and I don't think it is, throwing in the towel right now, would be a worse mistake, than not being prepared for the crash.
William Dirlam of Decision Moose may recommend to go to cash, enjoy the tax advantages of a large loss, and buy again once markets show more resilience. This is actually good advice, the problem is, there are very few people out there who have the discipline to get back in after throwing in the towel.
One for the record books
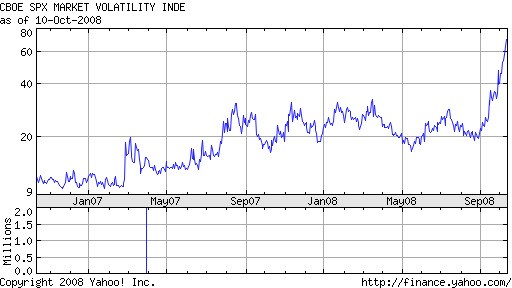
The drop of the past 9 days has been one for the history and record books. ^VIX, the volatility index reached 76.94 on Friday, an all time high record. Here's a 2 year chart of the ^VIX.
All the major US indexes are now trading historical oversold records, with the S&P 500, closing Friday almost 5 standard-deviations below its 200 day simple moving average (SMA200)
Friday, October 10, 2008 key ETFs close.
Standard Deviations below 200 day SMA:

-4.933		SPY     SPDR S&P 500 Index
-4.496		DIA     DIAMONDS Trust, Series 1
-3.573		IWM     iShares Russell 2000 Index
-3.289		QQQQ    NASDAQ 100 Trust Shares
-2.917		IYT     iShares Dow Jones Transportation Average
In percentage terms, SPY has closed Friday, October 10, 2008 over 32% below the 200 day SMA. This is the lowest I can find in my database. Here are the lowest 10 points since 1993:
SPY percent below 200 day moving average,
Worst 10 readings in the past 15 years:

        2002-08-05      -22.4492
        2002-07-25      -22.7354
        2002-10-07      -22.8152
        2002-10-09      -23.5616
        2008-10-07      -24.4386
        2002-07-22      -24.6387
        2008-10-08      -26.2011
        2002-07-23      -26.6106
        2008-10-09      -31.2028
        2008-10-10      -32.7157    <- you are here
If 5 standard deviations from the norm don't impress you consider corporate bonds. Right now the largest bond ETF (AGG) is trading at a massive discount of 8.9%. This is the closest I've ever seen to free money being offered for those who don't panic. AGG is an ETF with much lower volatility than stock ETFs. The top 6 ETFs trading below 200 day moving averages in standard deviations are all bond related. Note that none of these are actually Lehman's (the company which defaulted) bonds. Lehman simply came-up with the index:
Bond ETFs standard deviations below 200 day SMA
Based on a 1-year (252 trading days) sample:

1       -9.838	LAG     SPDR Lehman Aggregate Bond
2       -8.779	AGG     iShares Lehman Aggregate Bond
3       -8.325	CFT     iShares Lehman Credit Bond
4       -7.877	CSJ     iShares Lehman 1-3 Year Credit Bond
5       -7.272	BND     Vanguard Total Bond Market
6       -7.053	BIV     Vanguard Intermediate-Term Bond
Friday's last hour of trading in the US brought one of those rare ~700 points swings in the Dow Jones Industrials before settling down a bit. XLF, the financial sector ETF closed UP 10.3% for the day. No, a one day swing doesn't make a rally, but it just shows how fast and furious reversals can be. Staying short in this environment seems outright insane. I don't know whether Friday's impressive swing marked a short term bottom. Perhaps we need a few more days to finally make that bottom, but I do think that the market is setting itself to an impressive rally that might bring the S&P 500 back to 1150-1300 levels. Just as the fall was sudden and unrelenting, so will the rebound from these oversold levels be.
This is not because I hope this will happen, it is because that's what always happens following extreme deviations from the mean. The selling in the past 9 days included a lot of forced-selling from hedge-funds and capitulation selling from retail investors and 401(k) plans -- this is obvious seeing both the huge discounts to NAV I see on many ETFs, and the fact that mutual funds are doing so much worse than even the indexes.
Indiscriminate selling is always a psychological phenomenon. At a certain point all the people who tend to panic (at the worst moment, I should add) have already sold, and that's when buyers start pushing prices up. The reversion to the mean must come, sooner or later, and at this junction I think we should be awfully close.
No. I don't think the bear market is over. We will only know it is over in hindsight. I wouldn't be surprised to see (at least?) one more retest of these October lows after the rebound is over. Right now, I'll be looking to lighten up partially when the S&P 500 is back at 1100-1200 again. I would personally, try to be a buyer on the next week dips with the little cash I have left.
What history tells us
I'd like to introduce Mike Swanson (aka. Trader Mike). Mike has an impressive record since the mid 1990s. He is a self-taught trader and has a blog worth following. In his latest article: Here is the Stock market crash he goes back and looks at previous crashes. He covers 1973-1975, 1987, 2001-2002, and even 1929-1932. Here are some quotes:
I've been bearish on the stock market for over a year now. I've made a lot of money this year short-selling the stock market twice. A few times I went long and got stopped out. But overall I've done well, because I recognized the reality of the bear market, because of what technical analysis dictated. That is why I'm in cash now. But I never expected a correction like this to happen. I never expected the stock market to crash. [Guess we're in a good company here, Ed]...
The best case scenario would be a bottom like that seen in 1974. The consolidation period was shorter than the one seen after the 2002 bottom. After the bottom came in 1974 there was a quick lived rally and then a retest of the low. The market then went into a new bull market. One thing to note here is if you wanted to buy and hold you would have been better to do so on the retest, because you would have been able to buy the stocks that held up during the retest - they became the market leaders of the next bull market.
On the 1974 bottom the DOW was about 30% away from its 200-day moving average. Just like in 2002 - and just like at this moment.
A second person I'd like to introduce is another renowned market technician, L.M. Lowry of Lowry Research Corp. Lowry has studied market bottoms and key reversals for years. One of his most famous studies is the Lowry "90-percent days" study where he looks at those relatively rare days where 90% of stocks close down, and 90% of the daily volume confirms the direction. A reversal is (statistically) confirmed only when a 90% reverse day (90% closing up and 90% positive OBV confirms) occurs after multiple 90% down days. In the past two weeks, we have seen the multiple 90% down days, the reversal Lowry day seems close at hand right now. When it does, expect a rally resembling a volcano eruption.
I know there are people out there who think this is 1929 redux, and that a decade long, Japan style great depression is coming. I don't think so because there are huge differences. Unlike then, the economy is much more diverse and competitive. PE ratios and inventories are much lower, commodity prices and fixed costs are in free-fall, Governments around the world have made it clear they would do whatever it takes (see the G7 finance ministers communique this weekend).
Also anecdotally: my wife just came back from Valley Fair (a big Silicon Valley mall) observing that it was as hard as ever to find a parking space. While I'm sure Silicon Valley is not a representative of the whole nation, I remember my grandpa stories, and I can imagine what 25% unemployment rate is like. Even if unemployment rates double from the current 6% (highly unlikely), this would be nothing even remotely close to the great depression.
Yet the stock market did worse: as the moose puts it:
... find ourselves only down 400 and still breathing at Monday's close. Not to worry, Tuesday was down 500. Wednesday down 200. Thursday down 600. Not until Friday, did a ray of light shine through: only down 128 after opening down 700. It was the worst week in stock market history-- worse than 1929 and 1932 and 1987.What if I'm wrong? What if this is 1929 all over again? Again, history should teach us: after the big 1929 October crash, the Dow Jones rallied 48% before resuming its painful slide to the summer of 1932 bottom. I expect the upcoming rebound to be similarly impressive.
As always, this isn't intended as investment advice. It merely reflects my own thinking and actions at the time of writing. In the immortal words of John Maynard Keynes "When the facts change, I change my mind. What do you do, sir?"Every investor should make up their own decisions based on their risk tolerance and understanding.
Any feedback is welcome.
-- ariel