FFT pivot on 1 year (252 trading days) of IYT
IYT is the ETF representing the Dow Transportation Sector. It is considered a leading indicator for the markets (See Dow Theory)
Intro Case Pivot Position Simulation
IYT is also pretty volatile (beta=1.22 based on past year daily basis and sigma=1.04) and thus may be a good candidate for trading especially near the end of bear markets when it tends to lead up.
Here is a series of charts using the Fast Fourier Transform to approximate one year (252 trading days) of IYT chart using a small number of dominant frequencies:
The reason I chose 1 year is that I don't believe too distant past is very relevant and because 252 points have enough information content to be pretty well captured by a simple model without over-fitting, as the below charts show.
This is a significant point which I want to emphasize: having a line that is fitted-too well has the same effect as overfitting any model. By focusing too much on the "modelling the past", we start losing accuracy in predicting the future. We want a model that is complex enough to describe some reality but not too complex that it models random noise.
In this particular case, over-fitting has another undesirable effect. An ideal "pivot" line is one which the actual chart crosses right on the major-moves mid-points. The overbought/oversold distance on both sides of the pivot is proportional to the potential profit. We actually want a "rough" smooth line, that's not too fitted (close to the original points) because that takes away the biggest opportunities as well as forcing us to switch too frequently from short to long (and potentially increase transaction costs).
Let's look at the FFT smoothing charts.
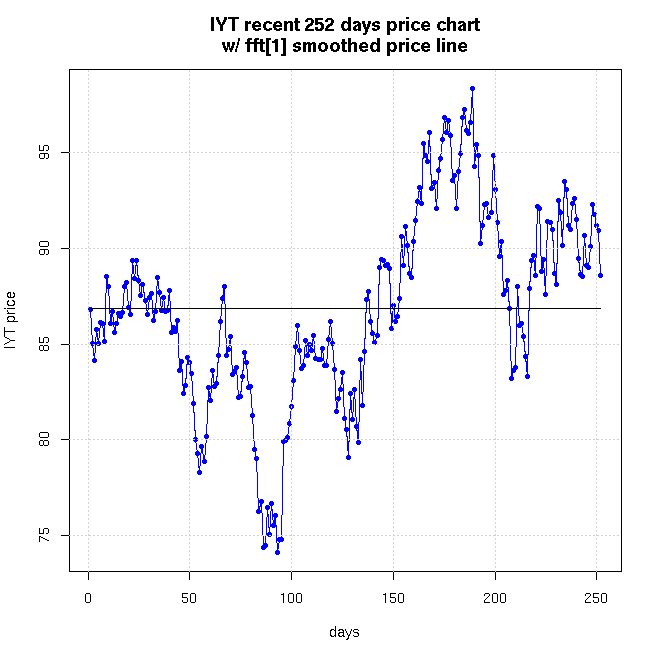
Using fft with (N=1) we get a horizontal line where y is the average of the price.
Using N=2, we get a sinusoidal line that starts to resemble the overall major cycles of the chart:

At N=3, we are a bit closer but the line is not bisecting the major moves close enough to their middle.

At N=4, we seem very close.

At N=5, the line crosses the chart enough times and pretty close to the middle of major moves to look both simple enough as a model (only 5 frequencies) and well exploitable.

Note that using FFT(5) leaves many sections of about 20 points (4 full weeks) all above (or below) the pivot. This is important to be aware of ahead of time so you know what to expect. It means that a short position may stay against you for about 4 weeks before you can finally realize and close the trade at a profit. Studying the chart and recent history, makes this obvious and provides the conviction needed to stick to the method when the going get rough.
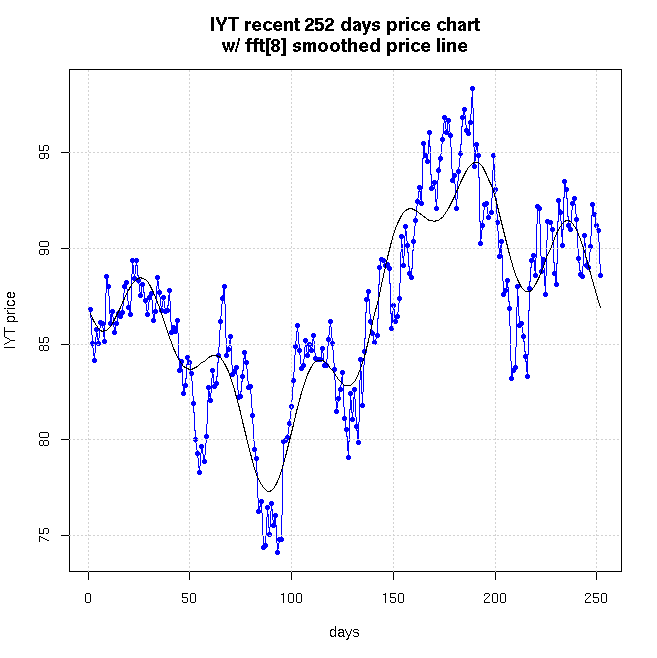
At N=8 the line already looks artificially over-fitted which also causes it to both 'undershoot' and 'overshoot' the biggest moves mid-points:
Note that this line is also a peek forward line, since all the smoothing approximations were calculated from all points in the chart. My interpretation (not a proof) here is that if there's anything periodic in the past year, it would be captured pretty well by 4-5 dominant frequency coefficients. There's no need for more.
By recalculating the FFT approximated line on a daily basis we could use it as a pivot for under/over weighting, while trading IYT.
Looking at the real-part in the coefficients of the FFT seems to reveal an interesting fact:
        fft Idx  (Real,   Imaginary)
---------------- -------------------
Top[2]: fft   2: (238.58, 638.60)
Top[3]: fft 252: (238.58, -638.60)
Top[4]: fft   3: (-92.57, -255.90)
Top[5]: fft 251: (-92.57, 255.90)
The periods are slightly shorter than 1 year and 100 trading days both of which are widely-used technical analysis periods for calculating MACD crossovers. When I look for N=10 coefficients, I get 2 additional pairs which are close to the widely observed 200 day (204.42), and 50 day (51.41) periods. My hunch (again not a proof) is that "1 year", "200 day", "100 day", and "50 day", are engrained in investor's psychology and actions, and as a result are the periods dominating the Fourier-transform.
Intro Case Pivot Position Simulation
Disclaimer: this should not be considered as investment advice. It is merely describing my own thoughts and actions.
Feedback is welcome.
-- ariel