July 6, 2007: market strategy battle royale (part 1 of 2)
Part 1: in which we demo our tools and test the waters with some strategy back testing.
This prepares us for part 2 in which the grand, CPU cycle sucking, mini-strategy, battle royale will be run. Highlights:Strategy visualization recap etf-rank: features, target-features, strategies Testing the waters: back-testing a 'pure value' strategy Back-testing the MMVR strategy Current ETF rankings. Next column.
Visualization recap
In the last column we showed how we can visualize a market strategy. If you missed that column, here's a link to it.We're now getting ready to look at a larger number of relatively simple strategies, using back-testing. But first, let's get more familiar with the tools.
etf-rank: features, target-features, strategies
A bit over a year ago, I wrote a program called etf-rank allowing me to rank ETFs according to arbitrary criteria.
For example I can quickly find the top 8 ETFs reverse-ranked (because lower PE is better) by their current (trailing 12 months) PE:
$ etf-rank -r pe 8
Using pe ranking method on 20070622 [note the date]
1	10.3000 PIC	PowerShares Dynamic Insurance
2	10.8300 KIE	streetTRACKS KBW Insurance
3	11.0600 OIH	Oil Services HOLDRs
4	11.1400 PRFE	PowerShares FTSE RAFI Energy
5	11.1500 IAK	iShares Dow Jones US Insurance
6	11.2200 VDE	Vanguard Energy VIPERs
7	11.2900 XLE	Energy Select Sector SPDR
8	11.3200 XES	SPDR Oil & Gas Equipment & Services
This isn't limited to simple features. By now I have over 70 composite ranking functions I can rank the ETFs by. For example: PEG (inverted to: Earnings Growth/PE so bigger is better) a year ago:
$ etf-rank -D 1y peg 8
Using peg ranking method on 20061222
1	 1.9939 XES	SPDR Oil & Gas Equipment & Services
2	 1.9570 PXJ	PowerShares Dynamic Oil & Gas Services
3	 1.8326 EWT	iShares MSCI Taiwan Index
4	 1.7220 OIH	Oil Services HOLDRs
5	 1.5672 IEZ	iShares Dow Jones US Oil Equipment Index
6	 1.5293 XHB	SPDR Homebuilders
7	 1.4980 ILF	iShares S&P Latin America 40 Index
8	 1.4236 EZA	iShares MSCI South Africa Index
As we've seen in the previous column, a bit formally stated, an investment strategy is a pair of:
By applying the predictor (a.k.a "model" or "ranking-function"), we hope to maximize the target feature (our goal) not just in the experimentation/learning phase, but also in real life.
- A target feature we are trying to maximize (e.g. "future 1-year return", or "lowest next 3-month volatility) and
- A model or "ranking function" which we hope is a good predictor of the target feature.
The ranking function can be as simple as: "pick the ETFs with the lowest P/E" or as complex as a machine-learned, non-linear decision tree which looks at all the ETF features for branching decisions. A simple example of a non-linear decision tree may be something like:
"if earnings-growth is over 15%, treat the ETF as a growth ETF and use Earnings-Growth divided by Price/Earnings (1/PEG) as the ranking function. Otherwise, treat the ETF as a value ETF, and use a combination of PE, PB, and Dividend-yield for ranking. Once the two groups have been ranked, normalize the two different ranges (growth and value) to the same scale and range, and finally pick the top N ranking ETFs for the portfolio."Testing the waters: back-testing a "pure value" strategy
Using historical data, we can go back in time and rank our ~400 ETFs at any prior date, even if the ranking function was just added. For example: we can go back one year, and see which 10 ETFs were the top ranking according to our overall value (PE, PS, PCF, PB) ranking function at that time. We may also want to exclude some ETFs, like US homebuilders. Assuming we already knew a year ago that US homebuilders were into a severe earnings-slowdown after a long multi-year run (US homebuilders are now in their 17th month of decline), so their trailing 'PE' was not really reflecting forward looking reality. Here's how this is done:
$ etf-rank -D 1y -x Homebuilders value 9
Using value ranking method on 20060622 [not current, note date!]
excluding 'Homebuilders'
1	 0.3960 EWY	iShares MSCI South Korea Index
2	 0.3782 PZI	PowerShares Zacks Micro Cap
3	 0.3749 PMR	PowerShares Dynamic Retail
4	 0.3707 PKB	PowerShares Dynamic Building & Construction
6	 0.3457 IXG	iShares S&P Global Financials Sector
7	 0.3408 EWZ	iShares MSCI Brazil Index
8	 0.3402 PIC	PowerShares Dynamic Insurance
9	 0.3356 IWN	iShares Russell 2000 Value Index
10	 0.3286 EWK	iShares MSCI Belgium Index
Notes:
- The
-D 1ytells etf-rank to go back 1-year (D stands for Date)- The
valueargument tells etf-rank to rank ETFs by value which is defined to be a geometric mean of the inverted weighted valuation ratios (PE, PS, PB, PCF) of the ETF holdings. The higher the "value", the better.- One homebuilder ETF (XHB, original position 5 according to trailing PE) was skipped due to the exclusion clause.
-x Homebuilders- "Building & Construction" is a totally different sector which has been doing well (think emerging countries buying Caterpillar heavy equipment) and should not be confused with U.S. Homebuilding.
Q: Were the above top ranked 9 ETFs a good choice for investing a year ago (June 2006) when the value model suggested them as good holdings for a year?
A: Yes, in fact, pretty good.
Here's a 1-year price chart of the above group, from the point the ranking was made, including the S&P500 (^GSPC) as a reference point:
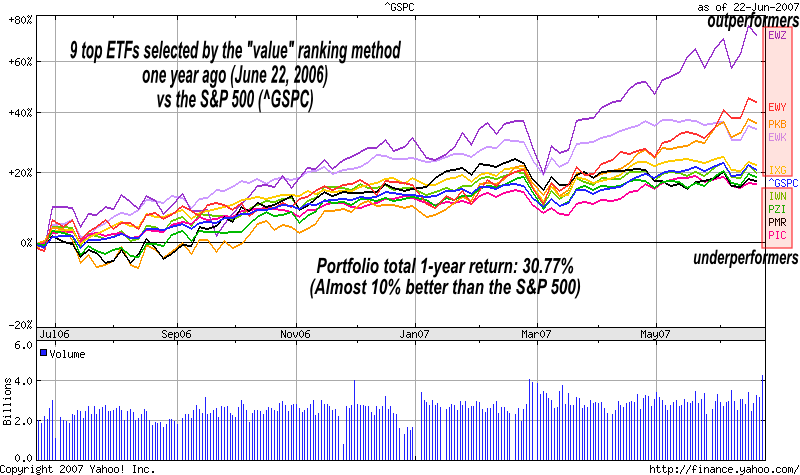
The S&P500 index had a very strong year with almost 22% return from June 22, 2006 to June 22, 2007. In this unusually strong year, it managed to beat 4 of the ETFs above (IWN,PZI,PMR,PIC) by about 0%-5%. On the other hand, the 5 remaining ETFs (EWZ,EWY,PKB,EWK,IXG) have beaten the index by a much larger margin on average as the chart shows, with the Brazil (EWZ) and South Korea (EWY) ETFs both returning over 70% and 40% respectively, for the trailing 12 months.
To verify this result, let's run a 1-year back-test on the portfolio (implemented by another small program: etf-pfbt, where 'pfbt' stands for PortFolio Back Test). etf-pfbt assumes portfolio component equal-weighting at inception and no trades for the whole back-tested period that follows:
$ etf-pfbt 1y 0y 1m EWY PZI PMR PKB IXG EWZ PIC IWN EWK
Portfolio: EWY PZI PMR PKB IXG EWZ PIC IWN EWK
1m Returns:  -1.05 5.92 2.06 4.07 2.90 2.31 0.41 5.17 -1.85 3.81 2.81 0.85
1y-0y	30.77%	avg 2.29% std 2.26% 1:0.99 SH 1.009 SO 1.491 DD -1.85%
This 'overall value' portfolio -- which is not actually our preferred strategy, let alone best strategy -- as selected one year ago, had returned 30.77%/year. Almost 10% above the S&P500 in a very good year for the S&P500.
Plus, it did it with a good risk-adjusted monthly return (Sharpe-ratio 1.009) and while losing only 1.85% in its worst month (February 22 - March 22, 2007) out of 12 months.
What if we didn't exclude the US homebuilders? The return would still have been 6% better than the S&P500: 27.18% for the same 1y year period, despite having one pretty obvious bad apple in the mix. The reason for mixing different ETFs is to avoid complete portfolio wreckage when we make errors. In investing, occasional errors are unavoidable.
Back-testing the MMVR strategy
Q: What if we used a slighly more elaborate ranking function such as MMVR (Moderate momentum, Value, Risk) instead of pure value?A: Since MMVR looks beyond value, it is much more robust. For example, it automatically avoids blunders such as the "pure value" approach tripping on the US homebuilders. The Results of MMVR were much better: Total return, and risk-adjusted returns both show significant improvement.
Here's a price chart of the top 9 ETFs as picked by MMVR one year ago, (9 + S&P500 = 10, only because that's the maximum number of tickers Yahoo! Finance allows on the same chart, it is also shifted by one week, just because I wrote this article over two weeks).
As you can see, MMVR has performed significantly better in both total return and risk adjusted return, than our "value only" approach It trounced the S&P500 for the period, with a 1-year return of 37.37%/year (vs 22.12%), as well as a risk-adjusted monthly Sharpe-ratio of 1.135 (vs 0.863):
And here's the best part: All 9 components have outperformed the S&P500. There wasn't even one underperformer!

Here are the corresponding sanity-checks using etf-rank to pick the top 9 tickers a year ago, and using the portfolio-backtest program to summarize the portfolio performance over the year that followed.
$ etf-pfbt 1y 0y 1m `etf-rank -D 1y -T mmvr 9`
Using mmvr ranking method on 20060629
Portfolio: EWK VOX EWP EWQ EWI EWG IEV EZU ADRD
ROCs:	   6.31 2.62 2.31 4.64 1.25 3.59 1.32 -1.86 4.82 5.17 3.45 -1.13
1y-0y	37.37%	avg 2.71% std 2.39% 1:0.88 SH 1.135 SO 1.574 DD -1.86%
$ etf-pfbt 1y 0y 1m SPY
Portfolio: SPY
ROCs:	   2.59 1.92 2.99 3.77 -0.26 2.96 0.20 -1.60 1.46 4.70 3.13 -1.46
1y-0y	22.12%	avg 1.70% std 1.97% 1:1.16 SH 0.863 SO 1.183 DD -1.60%
Again, the obligatory disclaimer: Nothing is guaranteed. Past performance is not necessarily indicative of future results. YMMV. In bear markets we will most certainly do much worse.
Another caveat: picking the top N ETFs for a portfolio is not generally a good idea because the top N (for a small N) often tend to be highly correlated. In order to get diversification in a whole portfolio, we should pick low-correlated assets. I hope to be covering this in August and start publishing full model portfolios that have much lower risk than the "top N" strategy.
Q: Nice backtest. Now what about the next 12 months?
A: There are no guarantees. In fact, what we're seeing is so good that I'm almost certain it won't repeat. Especially if we hit some long overdue slowdown in the economy which is likely. In any case, the currently top-ranked ETFs by mmvr are listed in the next section. A year from now, we should be able to go back and back-test these rankings.
Current ETF rankings
Here are last Friday's rankings (top 40 ETFs among over 400). My advice if you want to buy any, would be to wait for dips. Look at their charts, and buy when the opportunity presents itself. Never chase even the best of the ETFs, especially when they trade at the upper half of their 'channel'.
    $ etf-rank mmvr 40
    Using mmvr ranking method on 20070705
    1	     3.2513 TTH     Telecom HOLDRs
    2	     3.0621 DKA     WisdomTree Intl Energy
    3	     3.0085 EWG     iShares MSCI Germany Index
    4	     3.0005 EWY     iShares MSCI South Korea Index
    5	     2.8455 EWT     iShares MSCI Taiwan Index
    6	     2.7275 VAW     Vanguard Materials VIPERs
    7	     2.6491 DEW     WisdomTree Europe High-Yielding Equity
    8	     2.6102 DLS     WisdomTree Intl SmallCap Dividend
    9	     2.6052 DTH     WisdomTree DIEFA High-Yielding Equity
    10	     2.5648 EZU     iShares MSCI EMU Index
    11	     2.5597 DEB     WisdomTree Europe Total Dividend
    12	     2.5382 EFV     iShares MSCI EAFE Value Index
    13	     2.5341 IXP     iShares S&P Global Telecommunications
    14	     2.5183 IXC     iShares S&P Global Energy Sector
    15	     2.5138 DFE     WisdomTree Europe SmallCap Dividend
    16	     2.4884 VOX     Vanguard Telecom Services VIPERs
    17	     2.4772 RPV     Rydex S&P 500 Pure Value
    18	     2.4745 DOL     WisdomTree Intl LargeCap Dividend
    19	     2.4704 DWM     WisdomTree DIEFA
    20	     2.4672 PRFE    PowerShares FTSE RAFI Energy
    21	     2.4223 DOO     WisdomTree Intl Dividend Top 100
    22	     2.4194 EWQ     iShares MSCI France Index
    23	     2.4117 IEV     iShares S&P Europe 350 Index
    24	     2.4049 EWN     iShares MSCI Netherlands Index
    25	     2.4017 PRFN    PowerShares FTSE RAFI Industrials
    26	     2.3935 IYZ     iShares Dow Jones US Telecom
    27	     2.3826 FEZ     streetTRACKS Dow Jones Euro STOXX 50
    28	     2.3803 VDE     Vanguard Energy VIPERs
    29	     2.3747 DIM     WisdomTree Intl MidCap Dividend
    30	     2.3544 VGK     Vanguard European Stock VIPERs
    31	     2.3140 RYE     Rydex S&P EqWght Energy
    32	     2.3113 DDI     WisdomTree Intl Industrials
    33	     2.3091 EWC     iShares MSCI Canada Index
    34	     2.2983 MXI     iShares S&P Global Materials
    35	     2.2800 XLE     Energy Select Sector SPDR
    36	     2.2761 DBN     WisdomTree Intl Basic Materials
    37	     2.2732 WMH     Wireless HOLDRs
    38	     2.2661 PXE     PowerShares Dynamic Energy Exploration
    39	     2.2245 EFA     iShares MSCI EAFE Index
    40	     2.2084 DNH     WisdomTree Pacific ex-Japan Hi-Yld Eq
Next column: ETF strategy battle-royale: part 2: the actual match
Due to article length restrictions, I had to split this topic into two parts. I'll be presenting the final battle among many mini-strategies and the somewhat surprising results I got, in the next article (those who want to see it ASAP, just let me know.)
As always, I hope you found this column useful. Feedback, good or bad, is always more than welcome. Is there anything in particular you would like to ask that I can answer with my tools and data? Please don't be shy. Being able to start some future column with "a reader asks" would be neat.
-- ariel