Aug 17, 2007: Panic Antidote
Highlights:A look at the past month Model portfolio status. (Are you selling?) Perspective. What's your take on the markets? Shades of 1997-1998 Looking forward Other signals (Warren Buffett etc.) Current ETF rankings Charting opportunities Next column
A look at the past month
In the last column I wrote about how to pick a good mix of components to build a near optimal portfolio. If you missed that column, here's a link to it.When markets panic, all ETFs go down together (except the ones which are short the markets), and when everything goes down, all the correlations soar and approach 1.0. In this environment, even the cutest babies get thrown-out with the water. When some investors fear financials are in bad shape, they sell everything. It started with sub-prime lenders and homebuilders (and I think there's more fallout expected there). It continued with all financials, then it spread to non-financials including great diversified ETFs of countries with little or no sub-prime exposure, some with a weighted average PE of 12 and less.
It gets worse: leveraged hedge funds, like Goldman Sachs' now famed "Global Alpha" and "Global Opportunities", are forced to sell holdings good and bad, under redemption pressure which adds more downward pressure. Banks and mortgage companies, under distress from defaulting lenders, raise interest rates for everyone, including for those who have the best credit ratings (the so called Jumbo loans spiked by about 1% last week). And when credit dries out, the economy abruptly slows down, and consumers lose confidence which depresses retailers, etc.
The classic ripple effect, which creates bear markets and recessions has been spreading out, engulfing every asset class and world region.
Scary isn't it?
Model Portfolio Status
Before I go and describe the other side of the coin, I must, for the sake of full disclosure, provide a status on my model portfolio which I started on Jan 28, 2007. It has lost almost everything it gained for the year. The overall gain now stands at just +0.7%, down from about +11% just a month ago. And because of the portfolio slightly greater than 1.0 beta, it has dropped more than the major indexes, -10.57% in the past 30 days to be exact, according to Marketocracy. If the downward spiral continues, things could get worse. It is no longer outperforming the broad US indexes.
Q: So are you selling?No. I'm not selling. In fact, I've been buying. Being the optimist that I am -- and this is a fair warning to anyone following me blindly -- I noticed that some of my favorite international ETFs: South Korea (EWY) and Taiwan (EWT), have jumped once again to the top of the rankings due to better valuations and coming back to a 'reasonable momentum' range. So I've spent almost all my remaining cash buying them. Last week was my first ever buy of Taiwan, and right now, I'm a bit down on this particular buy. If I had more cash, I may have added Spain (EWP), the UK (EWU), and more Emerging markets (VWO) to the mix.
Perspective
Q: What your take on the markets?A: This is the most frequent question I got last week which made me scrap the column I already wrote, and focus on the current state of the markets. I've never got so many emails (and phone calls!) before, and since all of them were essentially about the same subject, I'll try to address the concerns here.
In pure statistical terms, the recent drop has been extreme. How extreme? Well, the S&P500 ETF (SPY) which was in record territory earlier in the summer, has gone all the way to erase all its gains and then some on a year to date basis, just before it popped back a bit. It now stands at +2.6% for the year.
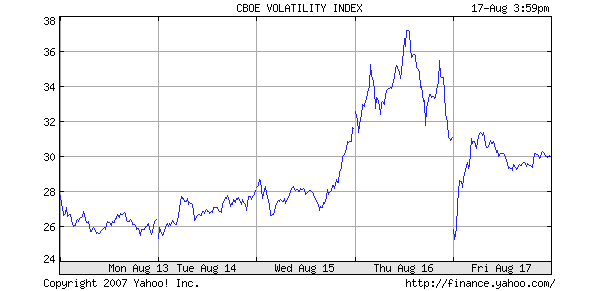
The VIX (CBOE SPX Volatility Index, which is an indicator of investor nervousness) has peaked at a over 37 last Thursday, the highest it has been in over 4 years. Here's a 5-day VIX chart showing the spike:
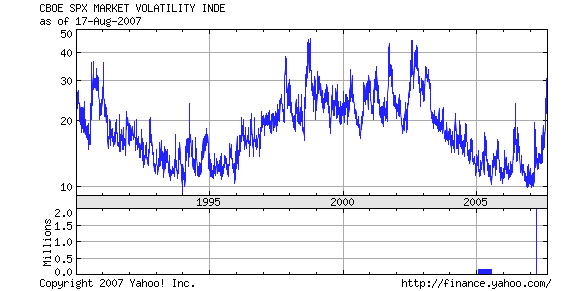
For perspective, in the past 17 years, the VIX has spiked to slightly over 40 only a handful of times. Exceeding 30 is a pretty rare event too, as you can see in this long term chart. Maybe most significantly: getting from around 14 to 37 in less than 3 months is something that I can't find anywhere in the 17 year chart.
Shades of 1997-1998
Which leads me to what looks most similar to the current situation. The Asian financial crisis [wikipedia article] of the late 90's.Some of the biggest spikes in the VIX happened during that crisis.
Anyone remembers the Asian financial crisis? The crumbling of Asian economies and currencies? It began in Mid 1997 with Thailand, Philippines, Hong Kong, South Korea, Malaysia, Indonesia, Singapore. It later lead to the Russian financial crisis and Russia defaulting on its debt, and finally to the collapse of Long-Term Capital Management in 1998. Some of the similarities between the two cases (VIX more than doubling in a short period, crumbling of financial institutions/funds, credit crunch, widespread defaults) are so striking that I believe a lot of the current fear can be attributed to psychological anchoring on the 1997-1998 crisis. Just as there are similarities, there are also some crucial differences.
Looking Forward
And this leads me to my take on the markets. At present, I'm siding with the optimists.
If you feel stressed and need to calm down to get the finger off the sell button, just look back at the above VIX chart. VIX has reversed sharply on Thursday, as the DJI went up 300 points in the final couple of hours of trading. This reversal, was followed by Friday's 'panic buying' after the Fed lowered the discount rate. The Fed signalled that it is ready to intervene without yet using its really heavy artillery: lowering the much more meaningful, 5.25% Federal Funds rate.
Then take another deep breath, and consider listening to some Pollyannas too. It helps.
Statistically speaking, the Pollyannas are correct much more often than the Cassandras.
More to the point, upsides are bigger after downsides, so after markets have sharp drops, the Pollyannas are even more accurate than they usually are.
And finally, the Pollyannas are definitely more accurate when stock valuations, in so many countries and regions, are low. This is in contrast to 1997-1998 at least as far as countries like South Korea and Taiwan are concerned.
Here's a brief collection of recent articles from the optimists:
- Bill Barker, Motley Fool, Aug 10, 2007: The Best Buying Opportunity in 12 Years?
- Tim Hanson, Motley Fool, Aug 16, 2007: Why You Should Be Buying
- Seth Jayson, Motley Fool, Aug 10, 2007: Responding to the Global Meltdown
- Gary Gordon, Seeking Alpha, Aug 16, 2007: Currency Harvest Fund Succumbs To Stock Market Malaise
- Gary Gordon, Seeking Alpha, Aug 16, 2007: Why The Bull Market Should Return
- Rick Konrad, Seeking Alpha, Aug 17, 2007: How to Deal With the Current Crisis of Confidence in the Market
- Emil Lee: Motley Fool, Aug 13, 2007: How Buffett Made Billions in Wells Fargo
Other signals
Perhaps more important than listening to the optimists, is trying to figure out what those with the best long term record are actually doing in times like these.One of the best long term records in investing belongs to Warren Buffett. Just like almost everybody else who is long and a long term investor, Buffet has been "losing."
According to TheStreet.com, assuming equal-weighting, Buffett was down 7% as of a week ago on about 30 positions. More importantly: Buffett was buying a lot on the way down.
Here's a detailed article, by James Altucher of TheStreet.com, on the recent Buffet losses and buys: How Did Buffett Stocks Fare in the Downturn?
My financial buddy, Tristan Yates of IndexRoll fame, made the following observation: Buffett is invested, among others, in several financial institutions, both banks and insurance companies. For example, Wells Fargo Bank which was in a precarious situation in 1990 when Buffett decided to bet big on its survival. May we assume that the man has more insight and understanding of the financial sector than those who sold anything "financial" in great panic? BTW: Berkshire Hathaway was one of the biggest gainers last Friday with a jump of over 4%.
Of course, the pessimists would note that his most recent buy is a railroad stock: Burlington Northern Santa Fe (BNI), and that buying infrastructure means being defensive. But Buffet also been adding to his Bank of America (BAC) position and had a strong buying bias overall, turing this downturn.
So we are in a good company. And while we've lost more than Buffett in percentage terms, we've lost much less than the Goldman Sachs "market neutral" hedge fund "Global Alpha". The Financial Times, echoing Gwen Robinson on hedge funds, reported ten days ago (August 8th) that Global Alpha was down 16% for the year even before last week's biggest slump, and I'm sure their financial models, data, and computer resources, are much bigger than mine, if that's some consolation.
Current ETF rankings
Here are last Friday's rankings after last month's big drop (top 40 ETFs among over 500). Beware of the UltraShort funds that got into the ranking due to the panic spike. Love the usual suspects: the best valuations internationally, energy, telecoms, and right now, financials too.
Using mmvr ranking method on 20070817
1	 1.9403	EWY	iShares MSCI South Korea Index
2	 1.5675	IAH	Internet Architecture HOLDRs
3	 1.5652	ITA	iShares Dow Jones US Aerospace & Defense
4	 1.4558	EWG	iShares MSCI Germany Index
5	 1.4260	PPA	PowerShares Aerospace & Defense
6	 1.2431	VDE	Vanguard Energy VIPERs
7	 1.2333	FXI	iShares FTSE/Xinhua China 25 Index
8	 1.2164	XLE	SPDR Energy Select Sector
9	 1.2045	TTH	Telecom HOLDRs
10	 1.1636	IXP	iShares S&P Global Telecommunications
11	 1.1586	SDK	ProShares UltraShort Russell MidCap Growth
12	 1.1363	BHH	B2B Internet HOLDRs
13	 1.1011	IYE	iShares Dow Jones US Energy
14	 1.0246	IEZ	iShares Dow Jones US Oil Equipment Index
15	 0.9692	VWO	Vanguard Emerging Markets Stock VIPERs
16	 0.9566	XES	SPDR Oil & Gas Equipment & Services
17	 0.9347	PXJ	PowerShares Dynamic Oil & Gas Services
18	 0.9106	EWS	iShares MSCI Singapore Index
19	 0.9089	IHI	iShares Dow Jones US Medical Devices
20	 0.9076	OIH	Oil Services HOLDRs
21	 0.8210	VOX	Vanguard Telecom Services VIPERs
22	 0.7350	EWT	iShares MSCI Taiwan Index
23	 0.7182	PWJ	PowerShares Dynamic Mid Cap Growth
24	 0.6916	PHO	PowerShares Water Resources
25	 0.6603	EWI	iShares MSCI Italy Index
26	 0.6582	VIS	Vanguard Industrials VIPERs
27	 0.6258	EWP	iShares MSCI Spain Index
28	 0.6111	PHW	PowerShares Dynamic Hardware & Consumer Electronics
29	 0.6044	WMH	Wireless HOLDRs
30	 0.5888	IXC	iShares S&P Global Energy Sector
31	 0.5858	IYZ	iShares Dow Jones US Telecom
32	 0.5750	UTH	Utilities HOLDRs
33	 0.5704	PTE	PowerShares Dynamic Telecom & Wireless
34	 0.5390	PRFE	PowerShares FTSE RAFI Energy
35	 0.5360	IGE	iShares Goldman Sachs Natural Resourc
36	 0.5337	IWD	iShares Russell 1000 Value Index
37	 0.5280	MTK	streetTRACKS Morgan Stanley Technology
38	 0.5243	EWL	iShares MSCI Switzerland Index
39	 0.5210	IGM	iShares Goldman Sachs Technology Indx
40	 0.5203	DDI	WisdomTree Intl Industrials
Charting opportunities
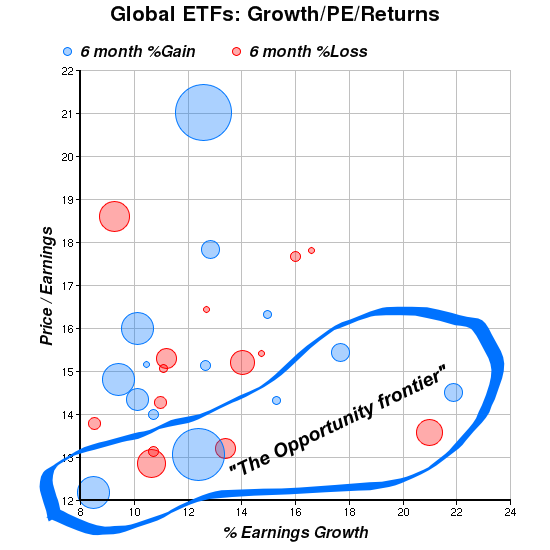
I'm now working with Tristan Yates and Juan Romero on a column which we hope will be published on Seeking Alpha. One of the thoughts we had, was to try and chart the best present opportunities internationally in light of the big drop.As a bonus, here's one of the charts I came up with. Look for strong candidates on the lower right frontier: good valuations coupled with good growth rates, which are now selling for much less than they were a month ago.
My favorite candidates are those along this "South-Eastern" frontier are those which have shown relative recent resilience: South Korea & Taiwan in Asia, Spain & the UK in Europe, and Emerging markets in general. If you buy Emerging markets, Vanguard World (VWO) looks better than EEM on a valuation, cost, and diversification basis.
The chart of world ETFs: P/Es as of July 31
(PEs should be about 10% lower by now)
[Needs JavaScript enabled for tooltips and clickabilty]Next column
As always, I hope you found this column useful. Feedback, good or bad, is always more than welcome.
I'm not yet sure what will be in the next column. It depends on what happens in the markets. I have many more ideas in the pipeline but I'm considering going back to an article once every month or so. See you then.
-- ariel