Dec 22, 2007: Beware of the Siren song
Highlights:The Siren song ECRI's Weekly Leading Indicators Revisiting the zero-correlated bearish portfolio
The Siren song
"In the stock market hope gets in the way of reality, hope gets in the way of common sense. If the stock market turns bearish and you're staying put with your whole position, and you're hoping that what you see is not really happening, then welcome to poverty city" -- Richard Russell (Dow Theory Letters)Last Friday, US markets turned euphoric after the Commerce Department report came out that consumer spending went up 1.1% in November.
The headlines gushed: "nearly triple the October gain", and "spending up by the largest amount in 3 1/2 years". On Wall Street, stocks surged. The Dow Jones industrial average finished the day up 205.01 points at 13,450.65. Not a single one of the 30 Dow components was down.
Whenever euphoria seems a bit out of place, it is worth taking a step back and looking at the big picture. Observers should ask themselves simple questions like:
Here's the real news: adjusted for inflation, spending rose only 0.5%, not 1.1%. This is far from being the best showing in 3.5 years. It is the best showing in just 11 months! In other words, this is the best increase in consumer spending since the previous (2006) holiday season.
- Who, exactly, is the source? How trusted it is? Hint: it's the commerce department, which is a part of the incumbent administration, and the time is less than one year before elections.
- How big were previous years' October to November jumps? Do such jumps have anything to do with normal holiday shopping? Hint: in 2006, the holiday sales jump was actually better (see below).
- Is a monthly 1.1% jump on holiday/shopping season really a big number?
- How does spending compare to the rise in incomes? Hint: incomes were also up last month, but the 0.4% income increase was far below the rise in spending. Consequently, the personal savings rate dipped into negative territory as households spent savings or borrowed (using Credit Cards) to finance November purchases.
- How big was the increase after adjusting for inflation? Hint: inflation rose 0.6% in November, the biggest jump in more than two years, reflecting last month's big surge in gasoline prices. Are we really spending more to get more goods in return or just spending more on volatile items like food and gas?
Looking deeper, retailers were discounting heavily to entice consumers. In the big retail chains, signs of 50% mark downs are everywhere. All signs point to an abysmal Q4 earnings season, not just in financials and home builders, but also in the retail sector.
Which news were ignored on Friday? The Fed announced on Friday the results of a second $20 billion auction of loans to banks, and the banks took it all. NPR's Marketplace nailed it: No money is moving until the Fed comes along offering money at higher rates than the inter-bank rate. No one seems to be trusting each other in the banking sector anymore. Many more write offs are coming.
And the next shoe to fall may well be the credit card issuers. In other piece of fresh news from the Associated Press, 30, 60, and 90-day delinquencies are all at record highs and climbing at an alarming rate (link and chart added: Dec 25, 2007).
Beware the Siren song of how strong the economy is based on one anemic 1.1% number published by the commerce department.
In such time of confusion and politically motivated false leads, who is a trusted source? The answer: those that it is their actual business to make predictions. Those with a long term record of meticulous data collection and trusted interpretation of that data. Which leads me to ECRI.
ECRI's Weekly Leading Indicators (WLI)
ECRI stands for "Economic Cycle Research Institute". ECRI has been in the business of trying to predict the economic cycle ahead of time since 1950. That's 57 years in this particular business. You don't stay in such business for so long unless you accumulate a great long term record and are trusted. Their web site is at www.businesscycle.com. I have learned that ECRI has the best forecasting record of the institutions in this business. It also has a longer lead than the Conference Board: 10 months in tops, and 3 month at bottoms, on average.ECRI have accurately called the last two recessions (1991, 2001) well ahead of time.
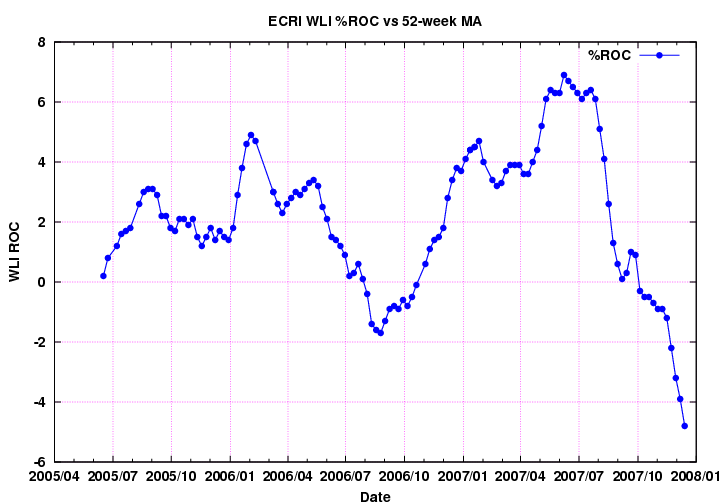
While the ECRI is not ready yet to call a (GDP) recession, they are seeing a major slow-down based on their Weekly Leading Indicators (WLI) rate-of-change (ROC).
The bad news: ECRI charge a lot for their reports and data. The good news: I did a lot of leg work to try and assemble the data for their most sought after metric: the WLI, or the "Weekly Leading Indicators" reading which I'm sharing here with you. Unfortunately, I wasn't able to find data beyond 2005 but I found this image showing that since Jan 2003, the ROC never dipped below -2% or so, and when it did dip below zero, it was a brief and shallow dip. Finally, the WLI stayed during most of this bull market in clear positive territory (0..12 range).
Notwithstanding last week's market euphoria, the WLI ROC now seems to be in a free-fall. It is getting close to -5%, a level not seen since Nov 2002.
To understand how grave the situation is, I recommend this blog quoting at length from an insider of the mortgage industry. What he says sounds a bit on the extreme side, to me personally, but I gather he has it nailed in that this is not a "subprime crisis," as many would like you to believe, but a nationwide mortgage/credit crisis whose consequences will be far more widespread than the market currently seems to discount.
My take from all this is that this euphoria is a good shorting opportunity and if we see a January effect spike, I would consider it a golden shorting opportunity.
Here's the ECRI WLI chart.
Here are the last 11 lines of the data-set, with commentary added:
Date		WLI	%ROC    Comment
2007/10/05      140.4   -0.3    unusual downward revision due to money supply
2007/10/12      139.7   -0.5    lowest since early October 2006
2007/10/19      139.7   -0.5    lowest since early October 2006
2007/10/26      139.4   -0.7    lowest since early October 2006
2007/11/02      140.1   -0.9    lowest since Sep, 2006
2007/11/09      139.9   -0.9    lowest since Sep, 2006
2007/11/16      139.1   -1.2    lowest since Sep, 2006
2007/11/23      136.9   -2.2    lowest since March 14, 2003
2007/11/30      138.2   -3.2    lowest since November 22, 2002
2007/12/07      137.9   -3.9    lowest since November 15, 2002
2007/12/14      136.2   -4.8    lowest since November 1, 2002
Revisiting the bearish zero-correlation model portfolio
The November revised bearish 8-ETF model portfolio is beating the SPY slightly in December, despite numerous euphoria days. Once the euphoria ends, it should do better. Its zero correlation is proving to be a great strength. The volatility, so far, is 30% lower than the SPY.
Portfolio[8]:   SDS TWM SRS IHF IXC DBA JXI KXI
%Change[15]:    0.70 1.36 -1.14 -1.05 0.03 -0.69 1.72 1.27 -0.61 0.85 0.61
		-0.58 -0.19 -0.32 -0.51

Correlation matrix [2007-12-01..0w/1d]:
       SDS  TWM  SRS  IHF  IXC  DBA  JXI  KXI
SDS      -  .96  .91 -.89 -.89 -.26 -.73 -.47
TWM    .96    -  .91 -.89 -.85 -.26 -.68 -.41
SRS    .91  .91    - -.79 -.80 -.18 -.64 -.32
IHF   -.89 -.89 -.79    -  .75  .18  .61  .25
IXC   -.89 -.85 -.80  .75    -  .39  .79  .62
DBA   -.26 -.26 -.18  .18  .39    -  .36  .50
JXI   -.73 -.68 -.64  .61  .79  .36    -  .76
KXI   -.47 -.41 -.32  .25  .62  .50  .76    -
					Mean correlation: -0.038028

[2007-12-01-0w/1d 8]  Portfolio    SPY    Portfolio-vs-SPY (better: > 1.0)
--------------------  ---------   ------  ----------------
%Total_Return:             1.40    -0.36              +INF
%Annualized:              26.36    -5.82              +INF
%Return_Mean:              0.09    -0.02              +INF
%Return_StdDev:            0.89     1.18              1.32
%Volatility:              14.16    18.69              1.32
%Max_DrawDown:            -1.14    -2.74              2.40
Omicron:                 1.2720   0.9509              1.34
Omega:                   0.6660   0.5581              1.19
Omega/Omicron:           0.5236   0.5868              0.89
%Alpha(annual):           24.48     0.00                 -
Beta:                     -0.58     1.00              1.71
Alpha/Beta:               41.96     0.00                 -
R(correlation):           -0.76     1.00              1.31
%R2:                      58.39   100.00              1.71
Sharpe_ratio:            0.1042  -0.0202              +INF
Sortino_ratio:           0.0923  -0.0236              +INF

Longs (in rough order of attractiveness):
DBA     PowerShares DB Agriculture
IHF     iShares Dow Jones US Healthcare Provider
JXI     iShares S&P Global Utilities
IXC     iShares S&P Global Energy Sector
KXI     iShares S&P Global Consumer Staples

Shorts (in rough order of attractiveness):
SRS     ProShares UltraShort Real Estate
TWM     ProShares UltraShort Russell 2000
SDS     ProShares UltraShort S&P 500
As always, investors should make up their own decisions. Any feedback, question, request, criticism etc. is very welcome.
-- ariel