October 31, 2008: Inflection Point (Short Term)
I recently wrote some R functions that let me zoom in in large detail on ETF charts. Let the charts do most of the talking.The 1st is the SPY chart. Last 30 days of trading (6 weeks). The light pink line is the 50-day simple moving average with one and two standard deviations above and below it marked in red and green respectively. The light turquoise line is the 1-standard deviation Bollinger Band of the 50-day moving average. The colored segments represent open, close, high, & low prices. Lines with a open to close range colored red are down days from open to close, and those whose middle is green have closed higher than the open. The two down-slopping purple and violet lines are the 100-day and 200-day moving averages respectively. They tell us that the major (long term) trend is still a clear bear. In the short term, on the other hand, we see clear consolidation and stabilization after the October big crash.
The bottom of the chart shows normalized volume peaks which often mark intermediate term tops and bottoms as the smart money moves out and back in. Finally the middle 'bandwidth' sub-chart shows the width of the Bollinger channel (gap between the two turquoise lines) vs where the current price is. Another reasonably good short term oscillator.

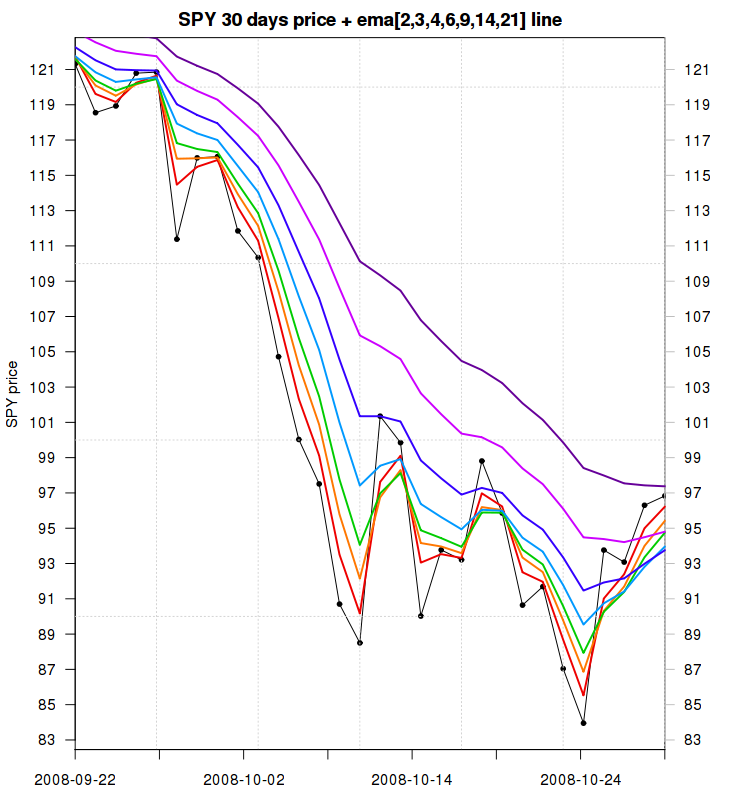
The next chart shows the SPY daily closing price with multiple short term EMA (Exponential Moving Average) lines. 2, 3, 4, 6, 9, 14, 21 days in length. Note how much stronger, both in duration, and in relative strength, the last week move up is compared to the prior two bear traps. 5 out of 7 of the short-term EMAs are now inverted in order (shorter above longer). The 6th EMA (14-day) is already pointing upwards, and the last 21-day EMA is almost horizontal.
Next: SCC, the Proshares Ultrashort Consumer Services ETF. One of the "safest" double short ETFs in times like these. SCC more than doubled in the past month. It is now in the middle of a sharp crash demonstrating how risky it can be to try and chase short term extreme momentum.

In the SCC case, the short-term EMAs are inverted in the opposite direction. What's the next stop for SCC? 113 on the 50-day SMA? 105 at the 100 day SMA? Perhaps 98 or so at the 200 day SMA and the prior support? Be very careful trying to get into shorts too early when they are in a free fall.

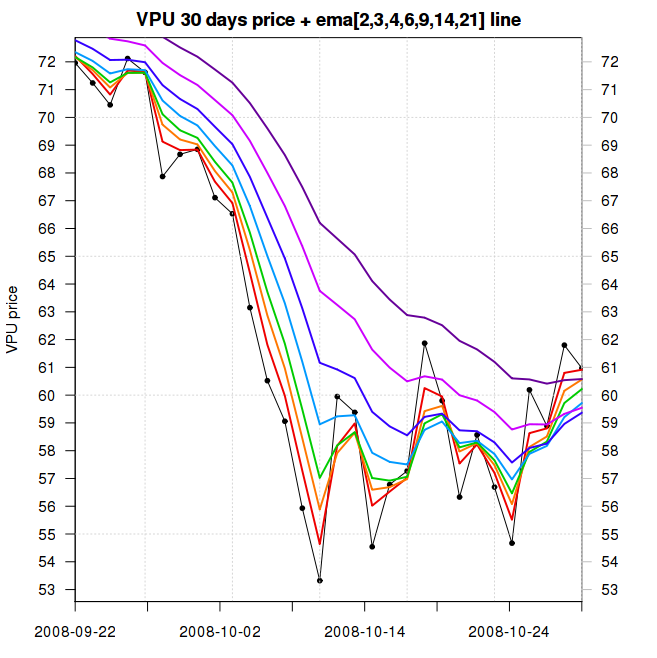
Are there any longs that show greater strength than the market as a whole right now? The following two ETFs (not a full list) are in that group. Both have bottomed before the rest of the market did. These are PGF (Preferred Financials) and VPU (Vanguard Utilities). PGF & VPU are showing a pretty convincing series of higher lows and, in the case of VPU, higher highs as well, since that bottom.


Finally, my current thinking is that we are doing a wide-range (20% !) sideways move with the S&P 500 oscillating between ~850 and ~1050. The short term (till christmas) path of least resistance is now up. I wouldn't be surprised to see the SPY back at about 1100 before long. I'm considering opening some market-neutral trades (half long half short) once the shorts like SCC get back to earth, trade at lower premium from their real NAVs and reach lines of stronger support. For now, as credit-markets are showing clear signs of of thawing, spreads have narrowed sharply from just two weeks ago, and Oil prices keep breaking new lows, I'd just sit back and enjoy the short term rallies when they come.
As always, this isn't intended as investment advice. It merely reflects my own thinking and actions at the time of writing. In the immortal words of John Maynard Keynes "When the facts change, I change my mind. What do you do, sir?"Every investor should make up their own decisions based on their risk tolerance and understanding.
Any feedback is welcome.
-- ariel