March 27, 2009: PIE's performance Update
Contents:PIE continues to out-perform The UpDown proxy account UpDown and personal account returns since inception Sharpe ratios and mean returns Student's paired T-Test: PIE vs. SPY
PIE continues to out-perform
Our PIE system continued to perform very well in February and March, in both absolute and risk-adjusted terms. Returns were good, consistent (low volatility), and had a very low correlation with the markets (see details below).This performance is even more remarkable when compared to the broader markets, given that SPY (our ETF proxy for the S&P 500) was on a literal roller coaster in 2009: down sharply in February and up sharply in March to end down -1.47 for both months:
$ etfpret 20090130 20090327 SPY
SPY [20090130..20090327]: -1.472896%UpDown proxy account
I've started to track PIE's performance in real-time on UpDown.com, in order to establish some independent 3rd party record, but I have to make it clear that this tracking is only approximate. There are certain rules one must abide by in UpDown (a liability), while in other respects UpDown is more permissive compared to a real account (an advantage). Still, I use similar strategies and methods and the two charts (UpDown.com vs real personal account) look pretty similar so far so I consider UpDown a pretty good proxy for PIE.
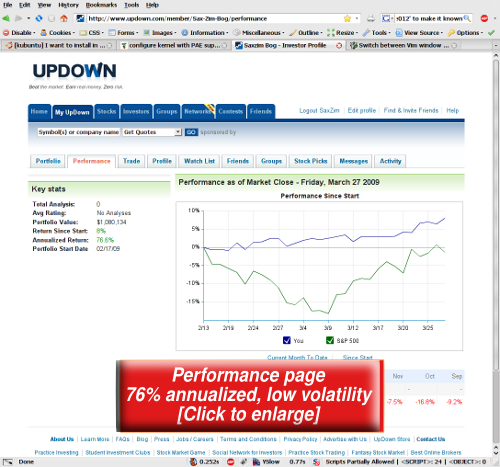
Here's the PIE's home page on UpDown on Friday showing a strong closure for the week.

UpDown and personal account returns since inception
PIE's personal (real) account is up a bit over 10% since January, while the UpDown proxy account is up almost 8% since mid February.
In March, the UpDown proxy account got "fully invested" in the PIE system -- which explains the acceleration in the chart -- while the real account remains a bit more conservative at about 75% exposure to PIE in March, and the rest in cash.
Extrapolating PIE's performance on UpDown.com to a full year now stands at over 76% annualized [Update: it rose to over 80% based on the full quarter close on March 31st].
Extrapolating the personal account is less meaningful because it started the year (in January) with a very small (~10%) exposure while staying mostly in cash. I about doubled the exposure in February, and more than doubled the account PIE exposure (to about 75%) in March.
Annualizing the full Jan-Mar period (about 10.1% up) comes down to 47%/year (1.101^4 = 1.47), while annualizing the past 4 weeks alone (5.213% return), comes down to 84%/year (1.05213^12 = 1.84). This is consistent with the increasing exposure to the system over time.
+5.213% per month in the real account translates to approximately +1.3%/week.
Sharpe ratio and mean returns
Our goal has always been to maximize our Sharpe ratio (as the objective on the profile states). The Sharpe ratio in real account (weekly sampled, annualized) now stands at 2.992 vs a negative -0.2921 for SPY (the S&P 500 ETF) since January.The returns of personal account in February & March were stable with only one week out of 8 slightly negative (-0.55%). The mean of weekly returns is 1.0825%/week for PIE (real account) vs. -0.9093%/week for SPY since start (Jan 2009).
And the best story is the low volatility which now stands at only 0.1162 of the volatility of SPY since January:
R> pie_vs_spy()
...
Real/actual volatility compared to markets, real account:
SPY: 13.0727% PIE: 1.5196% (ratio 0.1162)Here's how the picture looks on UpDown (note, covered period is only since mid February).

Student's paired T-Test: PIE vs SPY
A statistical paired T-test of PIE (real account) vs. the SPY shows we still have some way to go before we can establish a 95% confidence interval of PIE's superiority over SPY when it comes to comparing weekly returns alone. This is due to the small sample size: there aren't enough weeks in the sample to be 95% confident yet.
The T-test p-value now stands at 0.2069 (almost 80% confidence) and the weekly mean of differences is 1.99182%/week in favor of PIE vs SPY.
As always, this isn't intended as investment advice. It merely reflects my own thinking and actions at the time of writing. In the immortal words of John Maynard Keynes "When the facts change, I change my mind. What do you do, sir?"Every investor should make up his own decisions based on his risk tolerance, comfort-zones, convictions, and understanding.
Any feedback is welcome.
-- ariel


