Jun 2, 2009: Pie vs SPY - 2009 YTD chart
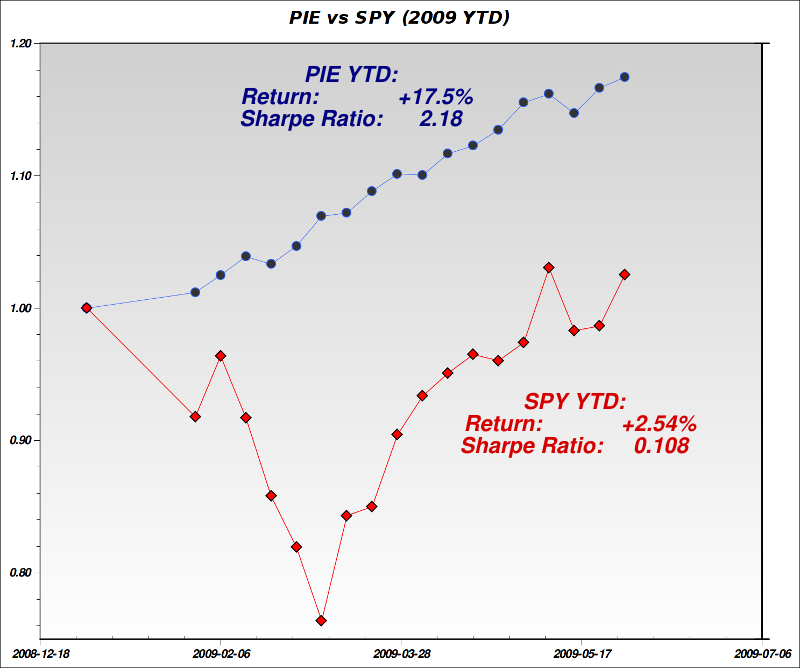
A picture is worth a 1000 words. The end of May update consists of one chart with a brief commentary. The following chart shows the actual performance of PIE (real trading account, not the UpDown proxy) in 2009 (YTD) in blue, vs SPY (The SPDR S&P500 ETF) in red. Samples are weekly samples except for the first 4-weeks of January which consist of a single (4-week) sample.
Notes:
- The chart represents the year-to-date (YTD) performance of PIE (real account) vs SPY (SPDR S&P500 ETF) for the period: 2008-12-31 till 2009-05-29.
- In January I was just dipping my toes in PIE and was very under-invested (about 10% initially). This is the reason for the comparatively low/moderate slope during January.
- Also, during January, I didn't record the weekly values of the portfolio so the first sample in the chart represents 4 weeks, rather than 1 week. PIE has been nicely up in all these 4 weeks, but the account rose relatively little in overall percentage terms, due to its small exposure to PIE at that time.
- In the months that followed (February - March), I gradually increased my exposure to PIE. I got close to 100% invested in March and kept the exposure high since then.
- In terms of activity, I was much more active in January and part of February than in later months as I've been improving the system to minimize activity. The present trading frequency is roughly weekly and it requires only a partial portfolio turnover.
- I'm not margined yet, but given the consistency of PIE's performance and low volatility, I now plan to get into margin. My broker charges me significantly less per year on this margin than my bank charges me for my mortgage so this is a no-brainer. Increasing the investment by 2x is expected to increase PIE's volatility by 2x (plus a tiny epsilon - since the current margin interest rate is negligible). IOW: I have a pretty good idea what is the risk I'm assuming by getting into margin.
- SPY (and the markets) had a terrible January and February and a very strong March, April & May. In contrast, PIE has been boringly consistent in all these 5 months with returns ranging between about 3% to 5% per month.
- Unmargined, and due to the use of hedging, PIE tends to underperform the markets during strong market months, and to out-perform the markets in weaker months.
- Overall for the year, PIE is up 17.5% (YTD). Way ahead of SPY which is up 2.54% (as of May 29th).
- PIE has been up 18 out of 21 weeks YTD, with only 3 down weeks - a weekly win/loss ratio of 6:1
- The above bias-ratio may look too good to be true so I need to note that PIE is only using liquid ETFs which trade daily on US exchanges and it has absolutely no exposure to any hard-to-value assets like Mortgage Backed Securities, or close-ended funds trading at large premiums or discounts to NAV. Moreover, due to the small size of my account and my experience so far in entering and exiting positions I doubt that liquidity or need to unwind under pressure would present a problem to performance in the next few years.
- PIE's average down week was -0.63%. The average up week was +1.09%
- PIE's worst week YTD (unmargined), was two weeks ago: down -1.26%. The second worst week was -0.55%.
- PIE's best week was up +2.15%
- In comparison, SPY's worst week was -6.78% in the week ending March 6th 2009. SPY's best week was +6.39% in the week ending March 27th 2009.
- SPY had several more weeks in 2009 with returns in the -4% to -6% range. PIE only remaining down (3rd worst) week was -0.085%.
- On a monthly basis: SPY was down -8.2% in January and down -10.74% in February. In contrast, all of PIE's months were positive.
- PIE's Sharpe ratio has declined in recent weeks and now stands at 2.18. It is over 20 times better compared with SPY's 0.108 Sharpe Ratio. [The way this Sharpe Ratio is calculated can be found here]
- Sharpe Ratio is what I try to maximize, and what I care about the most. I'm deliberately hedging to reign-down on volatility which reduces absolute performance during up markets. I do so in order to increase stability and predictability over time. PIE sacrifices a lot of beta in order to add alpha. Beta is a two-edged sword a fact that is sometimes easy to forget when markets are going up sharply as they have been doing in the past ~3 months.
The working thesis is that if you know your odds, and they are good enough, you can leverage in a controlled way to enhance returns. In other words: it is pretty hard to get 6 out of 7 weekly bets correct. Betting a larger sum once you know your odds are good, is trivial in comparison.
- Now that short-term interest rates are at record lows and that so many institutions are deleveraging is an ideal time for those with strong balance sheets to take cheap loans and assume more risk.
- I'm very happy with these results. They were made possible by almost 3 years of intensive thinking, coding, and trial-end-error. Jan - May 2009 are the best 5 months I've ever had in my trading account on a risk-adjusted basis. In the happy internet bubble days I had better absolute returns but I was totally unaware of the enormous risk I was assuming then. With PIE I'm acutely aware of my risk levels, and I'm constantly measuring and monitoring my portfolio volatility and correlation with the broader market.
But I have no illusions: What I've been doing is possible because I manage a relatively small account. I wouldn't have been able to keep this performance if I had to manage much bigger account. I'm sure that many sophisticated hedge funds and money managers with access to financial-engineering PhDs, significant computing resources, and data-sources I cannot dream of having access to - are employing similar methods to mine. The difference is that I can run rings around anyone with 50M or more under management. When I need to enter or exit positions, I do so quickly with very little effect on the underlying prices so I hope and expect to be able to keep this performance for a few more years. A few more years at this rate is all I need.
As always, this isn't intended as investment advice. It merely reflects my own thinking and actions at the time of writing. In the immortal words of John Maynard Keynes "When the facts change, I change my mind. What do you do, sir?"Every investor should make up his own decisions based on his risk tolerance, comfort-zones, convictions, and understanding.
Any feedback is welcome.
-- ariel