Oct 24, 2009: PIE vs SPY - Oct 2009 summary
A brief update for Oct 24 2009.
I've been slacking lately on these updates, so this one comes early, one week before the end of October. I'm sorry for not being able to update this site on a more frequent basis.
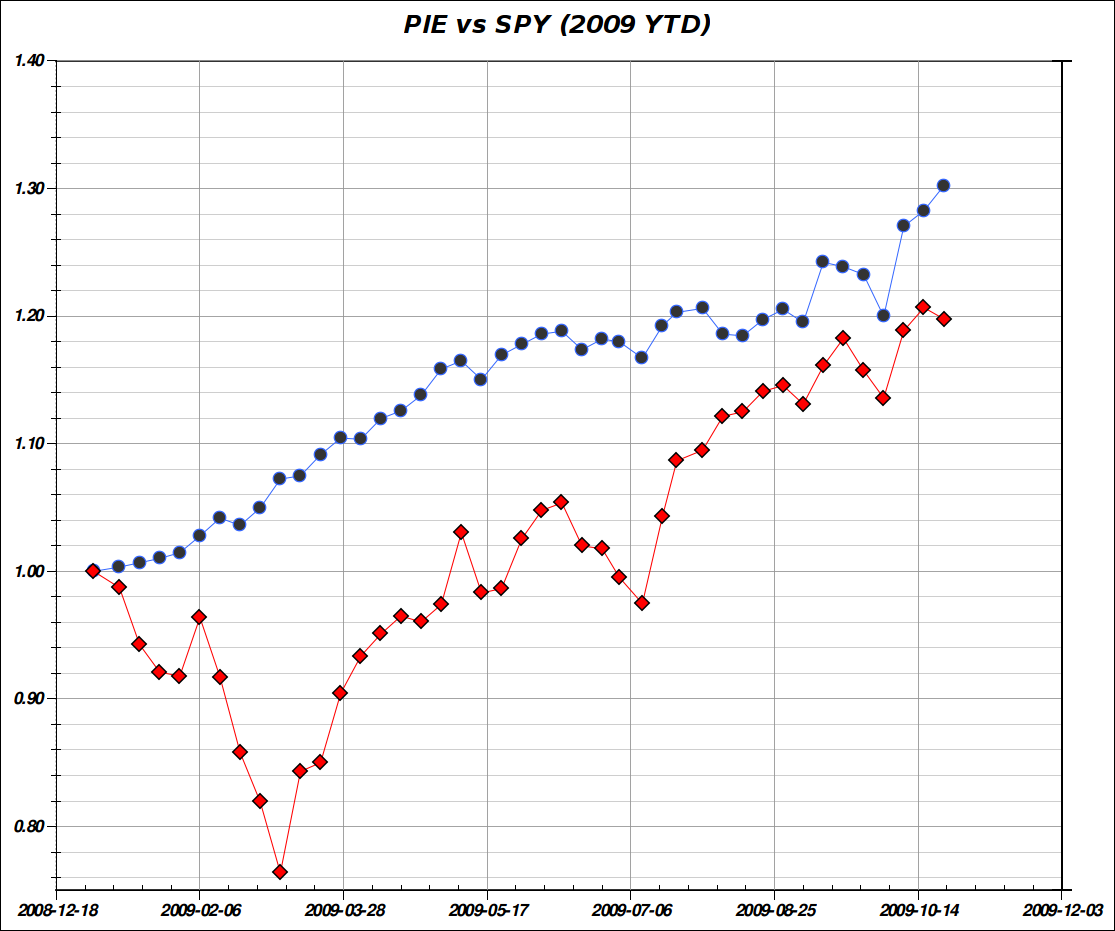
Below is the updated chart of PIE vs SPY for the YTD period till the week ending Oct 24.
The chart shows the actual performance of PIE, real trading account in 2009 (YTD) in blue, vs SPY (The SPDR S&P 500 ETF) in red. Samples are weekly samples.
Unfortunately, UpDown which I have been using as a independent 3rd part proxy "of sorts" has been showing some Marketocracy-like glitch signs of late. With over 40,000 registered users, there's corrupt data in most performance charts, so these charts no longer represent reality. Plus they have increasingly frequent "502 proxy errors" and general sluggishness. Must be the curse of becoming too popular. This led to me to lose interest in keeping my play portfolio there up-to-date. I'm focusing on the real portfolio instead.
My agressive hedging and market neutrality positioning during the summer turned out to be a very suboptimal strategy. In a raging bull market one should be less protected.
So around the end of August and start of September, I've used the market dip to cover most of my shorts to get more exposed to the upside.
In order to reduce risk while being mostly long, I partially re-emphasized a more robust version of the 2008 short-term trading component strategy It definitely helped as can be seen in the chart.
Notes:
- SPY has closed some of the gap while I was aggressively hedged -- clearly a mistake in hindsight -- during the summer months (April to August 2009).
- The gap has been extending again since I switched my macro view in September and adjusted weightings accordingly
- I'm now paying a price in higher volatility, but feel comfortable with the change. I plan to change posture when the tell-tell signs of a new bear are clearly seen on the horizon. I believe my experience now is much more likely to give me an early warning when this happens. Right now, the worst I can see is an imminent intermediate correction.
- You can clearly see the flattening of the chart during the summer vs the resumption of the higher slope, and higher volatility, in the past 2 months.
- My main "hedging" tool now is shorter-term trading, realizing partial gains periodically, as opposed to having permanent long and short holdings to offset downside.
- The recent week was especially good for the system with PIE gaining +1.53% vs SPY losing -0.74%. This is an exceptional result that I can't sustain given that it translates to about 120% annualized and knowing that such result is above my current risk tolerance level.
- The end of September and beginning of October saw the best week YTD with an unusually high weekly gain of +5.88% I'd be thrilled to finish the year with an average of 5%/month let alone a week. This looks like a tall order at this point due to the lost opportunity in the summer, but with the latest refinements to my strategies, I feel 3%/month average is likely, and 4%/month average is within reach.
- PIE is now slightly over 10% above SPY (YTD) while having a much lower volatility.
- YTD sharpe ratio of PIE is 3.27 times greater than SPY.
- I still have a few improvements in the works for PIE and hope to keep outperforming the markets on a both a risk adjusted and absolute basis for the rest of the year.
As always, this isn't intended as investment advice. It merely reflects my own thinking and actions at the time of writing. In the immortal words of John Maynard Keynes "When the facts change, I change my mind. What do you do, sir?"Every investor should make up his own decisions based on his risk tolerance, comfort-zones, convictions, and understanding.
Any feedback is welcome.
-- ariel