Sep 21, 2010: Three heatmaps
home faq articles premium contact
This is a brief follow-up to last Friday's article. to give some more color to my view that we're near or already at an intermediate top in the markets.
Yesterday, the NBER declared the recession has ended in the Summer of 2009 (yes, they are more than a year behind), and broad indexes broke out of the trading range they have been stuck in since May. Is this a reason to get bullish?
My model 1-20 day outlook: At the market top, April 26, 2010

(Click image to enlarge)
While bulls are already predicting breaking the next resistance levels and possibly end the year above the April highs, my models look at most 20 trading days (1 month) forward. I have no idea how the year will end, but I trust my models to guide me in the short to intermediate term.
For perspective and comparison, here's the synoptic heatmap of the day the markets topped earlier this year: April 26, 2010.
In these heatmaps, I had to extend the vertical range to [-20%..20%] to be able to cover the bottom without loss of detail.
The images are very similar with the main difference being that the April run-up was longer in duration, and accordingly, the anticipated correction has been longer as well.
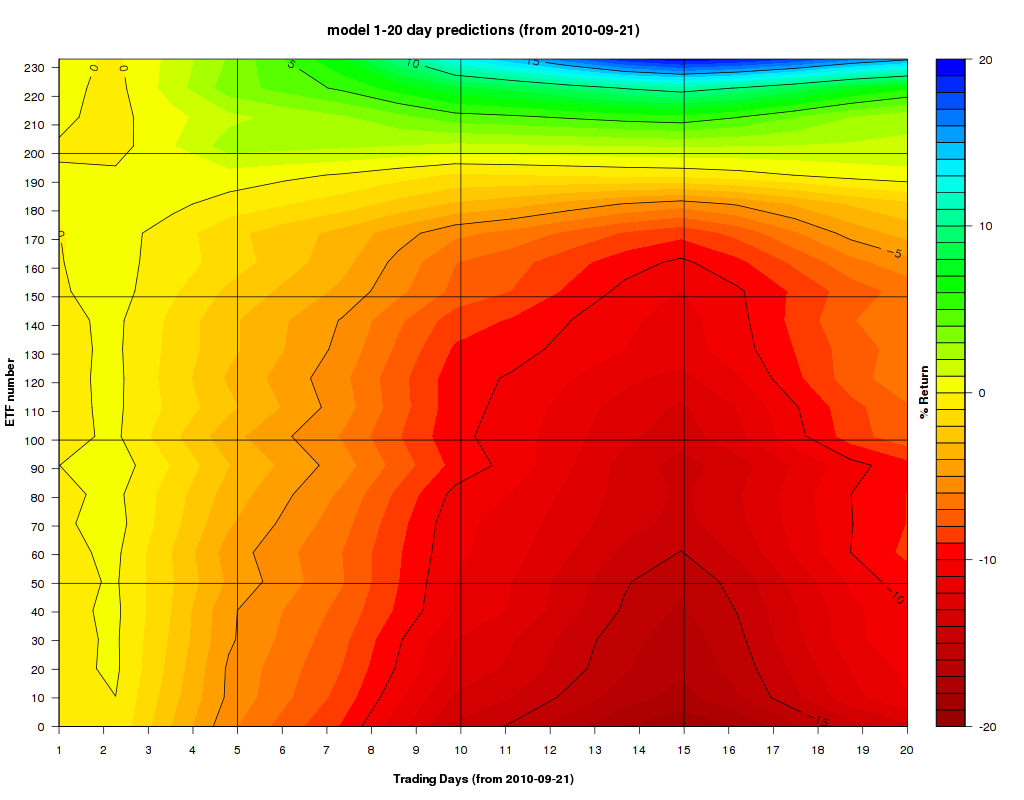
My model 1-20 day outlook: Today, Sept 21, 2010

(Click image to enlarge)
The coming anticipated correction seems to be shorter in duration with various ETFs much more correlated, it looks like most stocks are predicted to fall together and much less gradually than in April. This can also be confirmed by the few volatility ETF (blue at the top of the chart) which are anticipated to make a briefer and more violent move up into the end of September and the beginning of October.
My model 1-20 day outlook: a week before the April top, April 21, 2010

(Click image to enlarge)
Here's another reference point.
What was my models' outlook picture a week before the markets topped on April 26, 2010? As you can see, in this particular case, the orange/red area was significantly lighter, and there was still a bit of optimistic green and light yellow near the left edge of the heatmap, ahead in the 1-2 day (very short term) outlook. Almost exactly as it turned out to be in hindsight. Collectively on this particular day, the models were about 3-days off from identifying the exact April top.
Those who started shorting "early" on April 21, 2010 did not do badly at all. It is just that those who waited a week longer till the picture became wholy negative and a few leading ETFs started showing great weakness, did better on a risk-adjusted basis and on overall exposure. This would be my recommended action in this case as well.
All in all, it seems like we are now very near the point of maximum danger.
In summary
This is not a done deal. One caveat is that my model's most common error (about 20% of cases) being somewhat early because it models typical market behavior so it is sometimes, somewhat inaccurate on extended moves. In other words, the markets could still end up this, and maybe even next week, before they turn down.What is clear to me that a significant pressure has been building while bullish sentiment is near a 2-year peak, so I fully expect this correction to come and surprise a very large number of market participants, and especially the many new bulls who have jumped into this run-up in the recent week on the widely echoed hopes of a "great economic recovery."
The final confirmation would come when the S&P500 as a whole turns negative on the 5-day chart, and 5 or more of its sectors are down-trending, with the VWAP and AccDist lines confirming the reversal from the extremely overbought run-up. Only at that point I would feel confident to enter a position. Being ready is half the battle.
For now anyway, caution is strongly advised. The downside risk far outweighs the upside.
Brief update, Wed, Sep 22: Today's drop in the markets (especially in Financials) is not yet a confirmation. The 5-day trends of all US major indexes are still well within their upward-moving channels. This down day is, in fact, very similar to Friday's. One day doesn't make a trend.An interesting volatility pair trade suggested by Surely trader on pragcap, is to go short the March 2011 (6 months out) VIX futures and go long the October (1 month out) VIX futures. Surely trader notes that the VIX futures spread curve is extremely steep by historical norms (the gap is at an extreme 6.7 volatility points between the mid-term (expensive) and the short term (cheap) futures).
This is a bit similar to my model view that the short term volatility is too cheap right now, and is likely to jump and close the gap soon. The difference is that mine is a more risky directional bet, while Surely trader's bet is a hedged "gap should narrow" pair-trade.
And another supporting data-point: Investors Intelligence weekly sentiment survey, bullish sentiment among advisors is currently at its highest level since early August.
Update, Thursday, Sep 23:A confluence of strong signals is telling me that we have a confirmation for the anticipated correction:
Starting with the technicals:
- VXX has broken out of its downward 20-day channel on very high up-volume, with 3 green volume spikes in the past 5 days The trading volume of VXX in the past 3 days (near 30M/day) is about double of the 2-week ago low (14M shares).
- Although SPY remains in a 5-day upward channel (which looks very close to breaking) - all its 3 5-day VWAP lines (center, +2SD, and -2SD) are now pointing down.
- The tone in the financial news is becoming a bit more subdued indicating that the bullish buying pressure (buy every dip) is losing strength.
- The markets failed to hold key levels of support and SPY broke back under $113 with 2 lower highs and 2 lower lows (more if you include after-hour action) in 3-days.
- My 1-day model which is the least accurate of all my models has gotten into sync, and has been correct for 2 days in a row on the average, volume-weighted, direction of all tracked ETFs. Since both hits and misses of my models are time-clustered, together, I think this is significant.
And the fundamentals:
- After the close AMD has dropped an expected bomb, saying that sales in the third quarter ending September 25 would be down between 1 and 4 per cent compared to the $1.65bn in sales it posted in the previous quarter. The key is to understand this quote: "The sequential decrease is due to weaker than expected demand, particularly in the consumer notebook market in Western Europe and North America" -- obviously, Intel is killing them, but let's not forget that Intel themselves have lowered guidance recently.
- For a broader view of where we're going, and to save space here, I recommend reading:
- John Hussman's recent excellent weekly note to clients. and
- Diana Olick's expert views of the real-estate market.
Earnings expectations have been too euphoric. Regardless of whether we get a "double dip" or not, a 1% or near flat, GDP growth cannot possibly support the rosy growth predictions of corporate America we've been inundated with in recent weeks. With the poor US consumer (70% of GDP) aggressively deleveraging and trying to just keep their head over water, and the poverty rate jumping to 15% last year, I just don't see where the big earnings are going to come from.
I think we are at a long term earnings peak and I expect many companies to follow AMD and guide down soon, this quarter and possibly the next. This would set the stage for a significant reset of expectations and a significant correction in the markets starting with this one.
One more note: the past 2 days had pretty significant drops, it is totally expected for the markets to rebound a bit from these levels. This would provide a better opportunity to get into bearish positions, Tomorrow (Friday) or next week, especially on Financials and Small Caps. In any case, from now on, spikes should be used as opportunities to short rather than a reason to get scared as long as we keep making lower lows on the S&P500. Positions should be stopped-out only if SPY manages to break back above the prior lower high (now at about 113.6) which looks pretty unlikely to me at this point, given the growing number of investors ready to eject.
Ignore the after-hours action, and the futures trying to suck the last victims back in. Tune out of the news and the talking heads on financial TV. Expect typical bear market days with false-hopes, ups in the morning, followed by lower closes. I believe we are going into a very ugly end-of-September, 1st half of October. I trust my models more than anything else when it comes to the markets. I hope you find this useful.
home faq articles premium contact
All heatmap charts were generated by my 'hm' heatmap tool using predictive data from multiple independent models I have developed over the past several months.
The above merely reflects my own thinking and actions at the time of writing. Every investor should make up his own decisions based on his risk tolerance, time-frames, comfort-zones, convictions, and understanding. Never investment advice.
Any feedback is welcome.
-- ariel