SZDM ongoing performance record (note: dated material: Feb 2008)
Performance highlights of SZDM (Sax-Zim Data Mine, our marketocracy portfolio) since its inception on Jan 28, 2007. Latest on top. ... Abbreviations: MTD: Month to date, QTD: Quarter to date, YTD: Year to date ... Marketocracy percentile rank compares SZDM to ~80,000 other Marketocracy competitors. A higher percentile is better (e.g. a 90% percentile-rank (top decile) means beating 90% of the membership in overall performance.)Handicap notes
Marketocracy imposes a significant handicap on its players: accounts are charged a yearly fee of 2% of total capital. This means that in order to match the S&P500 long term return of ~10.5%/year, a participant has to actually exceed the S&P500 performance by almost 21.5%:
Solve for x:  (100 + (10.5 * x)) * 0.98 = 110.5
	     x = 1.2147716
Put in a simpler way: 2% of total (100% of) capital is roughly equal to 20% of a 10% profit.In addition, the accounts are charged the pro-rated fees on a daily basis (early) rather than at the end of the year or quarter, which makes the handicap worse than calculated above.
Marketocracy also imposes higher buying and selling fees than the typical discount brokerage account trading fees. Plus, the free site is often slow and unresponsive, making changes difficult during times I needed them the most.
As I was using Marketocracy, I've found that many of the new ETFs I wanted to buy, were not in Marketocracy's database at all. This forced me, several times, to compromise and buy inferior assets, additionally hurting both the fun and performance.
Due to these reasons, and the fact that I've lost interest in tracking this model portfolio closely, my real portfolios in 2007, have been consistently outperforming this difficult to manage model portfolio.
I keep whatever I collected here as a visible record of some lower bound of some real-life performance.
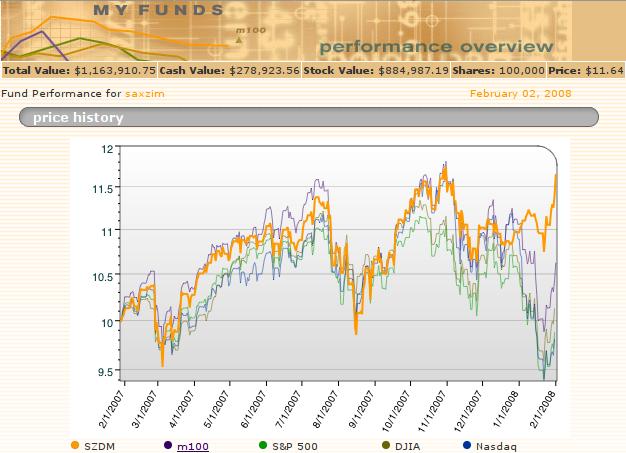
As of November 2007, I've turned bearish on US markets and I switched SZDM portfolio to a defensive mode (carefully selected longs with shorts of the broad indexes along the lines of what I described in this article) This move against the markets sharp downturn in Dec 2007 - Jan 2008 resulted in an almost instantaneous ~10% advantage of SZDM vs the index as can be seen in chart below.
While these results are good, I can't guarantee to keep working on SZDM. I prefer to invest my time improving my real models rather than spending too much time on Marketocracy.
SZDM performance: vs. Benchmark
S&P500 SZDM Date 1 month 3 months Since Inception 1 month 3 months Since Inception 2008-02-02 -3.47% -7.10% 0.02% 5.61% 0.98% 16.40% Date MTD QTD YTD MTD QTD YTD 2007-11-02 -2.54% -1.28% 8.05% -1.89% 2.95% 15.27% 2007-10-01 1.02% 1.02% 10.58% 1.37% 1.37% 13.49% 2007-07-06 1.85% 1.85% 8.94% 2.58% 2.58% 11.60% 2007-06-22 -1.74% 6.19% 6.87% -1.08% 5.58% 8.47% 2007-05-12 1.69% 6.20% 6.88% 2.20% 5.90% 8.80% 2007-04-13 2.32% 2.32% 2.97% 3.42% 3.42% 6.25%
SZDM performance: marketocracy percentile rank
SZDM percentile rank Date: 1-Month 3-Months 6-Months 2007-04-27 74.5% 72.5% - 2007-03-16 47.5% - -
Recent SZDM chart (performance vs major indexes & the m100)
Recent SZDM returns, alpha, beta & R-squared vs the S&P500
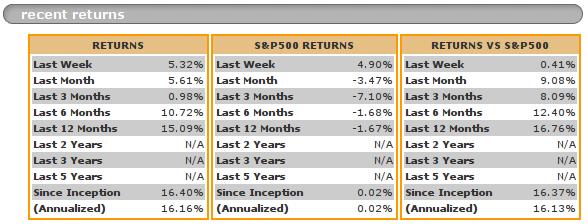
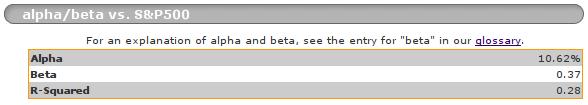
The bottom line is that as of February 2nd, 2008, a year + a few days since its inception, SZDM had a 16.37% total return advantage vs. the S&P500. In addition, it has a much lower volatility: a beta of 0.37, vs. the S&P500.
All this after being hit by a severe yearly handicap on alpha (see handicap notes above).
References (latest on top)
- All articles
- Nov 2007: roadmap for a bear
- April 2007: How are we doing?
- March 2007: On violent corrections and their aftermaths
- January 2007: My favorite ETF screen - Momentum / Value / Risk
- March 2006: An introduction to ETF visualization & general investment ideas
Marketocracy Links