July 20, 2007: market strategy battle royale (part 2 of 2)
Part 2: in which we present more support for our data-driven methodology using a lot of back-testing. Highlights:Last article recap Market mini-strategies battle royale MMVR parameter X-ray chart Current ETF rankings Next column preview Bonus: a good-mix portfolio
Last article recap
In the last column I presented some of tools I use to pick and back-test ETF performance (etf rank, and etf portfolio-back-test). I also ran some simple back testing to show how well we would have done had we followed two of our simple models top picks a year ago and haven't done any trading in the following year. If you missed that column, you may read it here.One of the most encouraging results of the previous article was realizing how well our favorite strategy has done vs. the S&P500 in the past year as summarized in the chart below (Obligatory note: this is not a currently recommended portfolio, it refers to strong MMVR candidates a year ago. Also: its components are too correlated to be used in a real-life portfolio):

We will now look at a large number of relatively simple strategies, and compare their virtues and weaknesses, using back-testing. My hope is to be able to make a pretty strong case for our data-driven approach to investing, across a very wide choice of parameters and strategies.
Market strategy battle Royale
First, a few ground rules: Our strategy is targeting 1-year total returns and risk adjusted returns for a "buy, and hold for 1-year" portfolio.
The 1-year hold restriction is designed to minimize tax impact.
With the ability to rank ETFs by any ranking-function, to back-test whole portfolio performances on their returns and risk adjusted returns, and having collected enough market data over the past ~16 months, we can now run a larger scale back-testing experiment covering many different mini-strategies.
Assume we had picked some strategy "X" one year ago. Then assume we had chosen the top-ranking N ETFs suggested by that strategy for our portfolio.To try and answer these questions, I picked a few of my 70+ strategies, and used etf-rank to go back 1 year in the past, and pick the best ETFs based on each strategy. In addition: I picked different sizes of portfolios from different pool-sizes of top candidates, then let the back testing program (etf-pfbt) calculate both returns and risk adjusted returns (Sharpe and Sortino ratios) for all of those large number of portfolios.Where would we be today? How big would the portfolio volatility have been in this past year? What would have been the steepest weekly decline of the portfolio during this year?
The experiment took a long time due to the large number of combinations. In the end I had many lines of data. Each line looked something like this (output simplified and header line added for explanatory purposes):
Ranking Function N: Number of portfolio components M: Size of 'top-M' selection pool 1-year Total return Weekly Return Average Weekly Return Standard Deviation Sharpe ratio Sortino ratio Maximum DrawDown (worst week loss) 1/pe 14 24 25.90% 0.48% 1.73% 0.276 0.377 -3.45%
Finally, because the output was very big and very hard to make sense of, I summarized it: For each varying parameter (Ranking function, portfolio size N, and candidate pool size M) I averaged the numbers of my two favorite target features: total 1-year returns and risk-adjusted returns (Sharpe ratios) to see which parameters did better on average.
The summary of the results appear in the two scrollable text-areas below.
Notes:
- Sharpe ratios are about 3-4 times lower than we saw in the previous article because this time they were computed on a weekly rather than a monthly basis:
- Each line in the tables below represents many (thousands of) data points.
- Both tables have the same data, they are just sorted differently. One by total return averages, one by Sharpe ratio averages.
- I won't go over explaining each of the mini-strategies. except saying that they are mostly simple linear combinations of various basic metrics like value, momentum, risk (beta, sigma), correlation with the market etc. Their individual details are not very important.
Attributes sorted by their 1-year total return averages:
Attributes sorted by their 1-year weekly Sharpe-ratio averages:
Some observations on these numbers
In a strong bull market, many sensible strategies work well. It is hard to be wrong when picking the very 'best' ETFs (top 10-20 ETFs out of about 400 by some quantitively sound metric) and hold for a year. The total portfolio returns range from about 20% to almost 40%. This is not very surprising in a year (June 2006 to June 2007) where the ETF representing the unmanaged, passive S&P500 (SPY) has returned 22%. A quick sanity check on the SPY confirms the 22% number:$ etf-rank ret1y SPY Using ret1y ranking method on 20070629 150 22.12 SPY SPDRs S&P500Even returning a very strong 22.12% made SPY (S&P500 ETF) rank far down the list: 150th place overall, in "1 year return" among all the ETFs we track. In other words: 149 ETFs out of about 400 have beaten SPY in this past year. Not surprisingly, picking any 'top 10' or 'top 20' by many reasonable methodologies, has worked well. For the curious (this is "a reader asks" question, actually): the best total return ETF in the past year was the iShares Mexico ETF with a 79.62% return.
1 79.62 EWW iShares MSCI Mexico IndexAlmost all (28 out of 29) of our hand-picked strategies have beaten the S&P500 in total return during the past 12 months without doing any trading. Not surprising knowing that these strategies were conceived during this bull market, where, as we already know, value ETFs reigned supreme.
However, many of these strategies are "sensible" in that they should be working well in other times as well. For instance, we know "Value beats Growth" about 75% of the time, so having a value component (the letter 'v' in many of the ranking functions above) improves our chances of success. The same reasoning works for momentum (the letter 'm' in many of the ranking functions names above). By definition, an asset cannot return X%/year without first returning Y% (where Y < X) - catching an already moving train works more often than not.
When looking at a full year, there's a strong correlation between returns and risk-adjusted returns. The linear correlation in the data-set above is 0.8565. This should be obvious since total return is a result of many small returns from which we calculate the overall risk-adjusted return (Sharpe ratio.)
Too big candidate pool-sizes hurt performance. Once we decide on a preferred ranking-function, it is better to pick N out of the top 30 or so ETFs than N out of the top 50. This is something not totally intuitive: diversification (larger candidate pool) helps, but only up to a point. By going down the list we are further and further diluting the contribution of the strong and proven ranking-function we've picked in the first place.
Perhaps surprisingly to some, picking a pretty large N (number of components to hold in the portfolio) doesn't seem to hurt much In this data, N=16, followed by N=14, and N=12, seem to be the best in both total returns, and risk-adjusted returns, beating the much more "concentrated" portfolios of 6, 8, and 10 components. This may be because being wrong always costs, and spreading the risk mitigates the risk of being sometimes wrong. So diversification proves itself once again to be very important. Looks like picking 10-16 ETFs out of a pool of 20-40 or so top-candidates provides a roughly optimal mix of diversification (large pool to pick from) and quality (high rank).
Surprise: MMVR (Moderate momentum + Value + Risk combo ranking) has not been the best model in the past year. It ranked 5th in terms of risk-adjusted returns (weekly Sharpe ratio: 0.34), and 9th in average total-returns (1-year average portfolio return: 35.77% over all pool sizes and portfolio sizes). Still, 35.77 is an amazing return for the relatively low risk we're assuming in our diversified portfolios. I'd be happy to have a 20%/year average. Moreover, I don't expect to get anywhere near this once the next market downturn strikes.
MMVR holds a distinctive advantage in that I came up with it early on, rather than in hindsight. The reason is that it was so sensible and simple to understand, while looking strong at the time. MMVR has been a very good predictor for future 1-year performance as well as risk adjusted return so far. I consider MMVR a strong, simple, linear model.
I'll hopefully get to cover non-linear models in the future. Simplicity in itself is a great virtue in machine learning because it is much more resistant to over-fitting the model to the training data. The few models that have beaten MMVR in this experiment have done it by very small margins that are likely random and not statistically significant.
It seems premature to change my preferred model at this point based only on these results.
Bottom line summary: Almost all the top performing strategies target some combination of good momentum, good value, and low risk. This combination passes both the sensibility test and the rigorous back-testing experiment over many possible portfolio sizes and candidate pools during this particular bull market.
MMVR parameter X-ray chart
Since a picture is worth a 1000 words, let's take a look at 6-month future total-returns vs. Sharpe-ratios vs. pool-sizes for some random (ending May 2007) MMVR ranking sample. Each circle in the chart represents the return and Sharpe-ratio averages of a large number of different backtested portfolios. I annotated the chart for clarity:
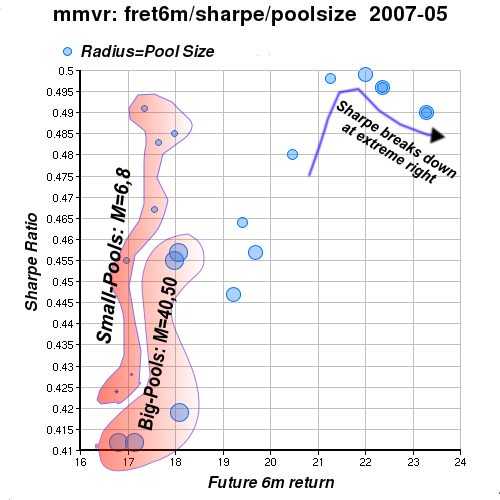
Observations from the chart:
- Most circles lie along the main diagonal. I.e. there's a positive correlation between total returns in the year after portfolio selection, and the risk adjusted measure of weekly returns.
- This correlation breaks at the extreme-right. In order to get the last 2 percentage-points of total return, something must give. We're taking too much risk for these 2 additional percentage points, and the Sharpe-ratio breaks down.
- Too big pool-sizes (40-50 ETFs to pick from, bottom left, big circles) are an overkill which hurts both total and risk adjusted returns.
- Too small pool-sizes (small circles on the left) are bad as well if we're wrong (and we almost always are) on 1 ETF out of 4 our overall portfolio returns may get hurt significantly.
- The ideal pool size to select from (best M values) seems to be between 20-36 based on this particular data.
I have to say one more thing about MMVR ranking. I'm not forever committed to it. It appears robust, simple, sensible, validated by back-testing, and strong, but my overall view is that markets are complex and driven by investor sentiment to a large extent. Sentiments and preferences change over time, albeit slowly. My guideline is to try and track what works at present, and adapt over time. With all the tools I have now and future tools I plan to build, I hope this prevailing sentiments tracking to work well under other circumstances and markets.
Current ETF rankings
Here are today's (2007-07-20) rankings (top 40 ETFs among over 400):
Using mmvr ranking method on 20070720
1        3.5998 PRFN    PowerShares FTSE RAFI Industrials
2        3.2100 TTH     Telecom HOLDRs
3        2.9355 DIA     DIAMONDS Trust, Series 1
4        2.9033 VOX     Vanguard Telecom Services VIPERs
5        2.7583 EWG     iShares MSCI Germany Index
6        2.7220 DKA     WisdomTree Intl Energy
7        2.6396 PRFE    PowerShares FTSE RAFI Energy
8        2.5812 FEZ     streetTRACKS Dow Jones Euro STOXX 50
9        2.5460 DLS     WisdomTree Intl SmallCap Dividend
10       2.5406 VDE     Vanguard Energy VIPERs
11       2.4806 VGK     Vanguard European Stock VIPERs
12       2.4745 DWM     WisdomTree DIEFA
13       2.4697 EZU     iShares MSCI EMU Index
14       2.4383 EWK     iShares MSCI Belgium Index
15       2.4199 ADRD    BLDRS Developed Markets 100 ADR Index
16       2.4191 EFV     iShares MSCI EAFE Value Index
17       2.4133 DEW     WisdomTree Europe High-Yielding Equity
18       2.4073 RYE     Rydex S&P EqWght Energy
19       2.3990 PXE     PowerShares Dynamic Energy Exploration
20       2.3578 DOO     WisdomTree Intl Dividend Top 100
21       2.3511 IXP     iShares S&P Global Telecommunications
22       2.3467 ADRU    BLDRS Europe 100 ADR Index
23       2.3442 DTH     WisdomTree DIEFA High-Yielding Equity
24       2.3304 EWN     iShares MSCI Netherlands Index
25       2.3169 IEV     iShares S&P Europe 350 Index
26       2.2916 EWQ     iShares MSCI France Index
27       2.2909 IXC     iShares S&P Global Energy Sector
28       2.2821 DFE     WisdomTree Europe SmallCap Dividend
29       2.2815 VIS     Vanguard Industrials VIPERs
30       2.2785 DIM     WisdomTree Intl MidCap Dividend
31       2.2657 DOL     WisdomTree Intl LargeCap Dividend
32       2.2526 DEB     WisdomTree Europe Total Dividend
33       2.2478 IEO     iShares Dow Jones US Oil & Gas Ex Index
34       2.2475 XLE     Energy Select Sector SPDR
35       2.2359 EFA     iShares MSCI EAFE Index
36       2.2046 EWT     iShares MSCI Taiwan Index
37       2.2008 UTH     Utilities HOLDRs
38       2.1982 VO      Vanguard Mid Cap VIPERs
39       2.1917 RPV     Rydex S&P 500 Pure Value
40       2.1816 IYZ     iShares Dow Jones US Telecom
Next column: towards an optimal portfolio mix
In this back-testing experiment I used etf-rank with the intention of selecting N components out of M top-ranked ETF candidates for a near optimal portfolio. The astute reader would note that I've left one secret out: how did I pick these N out of M?In the next column I'll pay tribute to Prof. Harry Markowitz, and try to find which N components should be picked out of a pool of M possible candidates. By refining the process I expect to find a way to make our already good average results, a little bit better still.
To give you a taste of how much better a good mix can be, I'll conclude with one.
Moving from the top-N ranked ETFs to an actual good mix portfolio
The dominant themes in recent (past 3 months) top rankings have remained pretty stable:Basic materials (DBN, PRFM, MXI, VAW) used to be ranked among the top ETFs during most of the past 6-month period, but have weakened lately due to having too much momentum (gains of 25-30% in the past 6 months) so they are ranking a bit lower (40-78) right now. South Korea which I mentioned as "too compelling to ignore" value in my January 12 column, had an even bigger run (over 40% in 6-months) so it sinked from the top 10 to 53 today (July 20, 2007) I think you should wait for a pull back to the general trend line, before getting in.
- Far-east value countries (EWY: now @53 due to extreme recent up-movement, EWT)
- European value countries (EWG, EWK, EWQ, EWN)
- Energy (DKA, PRFE, VDE, IXC, PXE)
- Telecoms (TTH, IXP, VOX)
- Industrials (DIA, VIS (ranked 43 today))
- Large cap value, both domestic and international (DOL, ADRD, ADRU, VTV, RPV)
July 28, 2007 update: EWY is back up to MMVR rank 2 after dropping significantly in the July correction and getting up-to-date valuation data. I used this drop to add more EWY to my portfolios.Here's a good 9-ETF portfolio combining the above themes with a low overall correlation, high alpha, and low beta based on the past 18-weeks (about 4 months). Today (July 20, 2007) as the S&P500 lost 1.01%, the NASDAQ lost 1.19%, and the DJI lost 1.07%, this portfolio has lost only 0.83%.
[Note: inaccurate previous data for DIA, mean correlation,
 and ranking corrected, July 28, 2007]

Portfolio[9]:	EWT TTH EWY DIA EWN EWG PRFE DBN EFV
%Change[18]:	0.41 3.09 0.48 2.48 1.28 0.11 0.13 1.87 0.31
		1.59 0.79 0.02 0.02 1.71 -0.37 3.28 2.84 -0.08

Correlation matrix [18w..0w/1w]:
       EWT  TTH  EWY  DIA  EWN  EWG PRFE  DBN  EFV
EWT      -  .10  .53  .01  .19  .18  .23  .53  .36
TTH    .10    -  .24  .37  .23  .35  .58  .49  .51
EWY    .53  .24    -  .27  .24  .40  .41  .72  .54
DIA    .01  .37  .27    -  .51  .41  .58  .33  .60
EWN    .19  .23  .24  .51    -  .64  .62  .49  .70
EWG    .18  .35  .40  .41  .64    -  .49  .65  .79
PRFE   .23  .58  .41  .58  .62  .49    -  .66  .73
DBN    .53  .49  .72  .33  .49  .65  .66    -  .81
EFV    .36  .51  .54  .60  .70  .79  .73  .81    -
					Mean correlation: 0.458894

[18w-0w/1w 9]	Portfolio	   SPY	Portfolio-vs-SPY (> 1.0 is better)
-------------	---------	------	----------------
%Total-Return:	    21.81	 10.90		    2.00
%Return Mean:	     1.10	  0.58		    1.91
%Return StdDev:	     1.15	  0.90		    0.78
%Max DrawDown:	    -0.37	 -1.07		    2.89
%Alpha(annual):	    31.38	  0.00		       -
Beta:        	     0.97	  1.00		    1.03
R(correlation):	     0.76	  1.00		    1.32
%R2:         	    57.52	100.00		    1.74
Sharpe ratio:	   0.9578       0.6389		    1.50
Sortino ratio:	   1.0971       0.5728		    1.92

MMVR rankings on July 20, 2007:
2        3.2100 TTH     Telecom HOLDRs
3        2.9355 DIA     DIAMONDS Trust, Series 1
5        2.7583 EWG     iShares MSCI Germany Index
7        2.6396 PRFE    PowerShares FTSE RAFI Energy
16       2.4191 EFV     iShares MSCI EAFE Value Index
24       2.3304 EWN     iShares MSCI Netherlands Index
36       2.2046 EWT     iShares MSCI Taiwan Index
48       2.0938 DBN     WisdomTree Intl Basic Materials
53       2.0554 EWY     iShares MSCI South Korea Index
As always, I hope you found this column useful. Any feedback is always more than welcome.
-- ariel