The Tao of Trading - Choosing a Pivot - Ariel Faigon (2008)
Intro Case Pivot Position Simulation
The Optimal Pivot Problem
While Archimedes did not invent the lever, he wrote the earliest known rigorous explanation of the principle involved. According to Pappus of Alexandria, his work on levers caused him to remark: "Give me a place to stand on, and I will move the Earth."The goal in establishing a pivot point is to have a leverage point to stand on. The pivot is our 'zero', our reference point. It enables us to decide how "high" or "low" our asset is at every point in time by looking at its vertical (price) distance from the pivot. In other words, our position at each point in time (t) is a function of the difference between the pivot, and the current price:
Position(t) = f(Price(t) - Pivot(t))It is important to note at this early stage, that the exact location of the pivot can only change our leverage and profit size. It does not change our ability to beat buy-and-hold. If this sounds like an absurd claim, consider the following very sub-optimal pivot: a horizontal line that lies above all our price points. This pivot doesn't adjust over time so it never lies close to the "average" asset price, in fact, it doesn't change at all with time.
In this case, we can still change our relative position, even if we are long all the time, between 0% long and 100% long.
Since the pivot is always above us, we would be fooled to believe that the price is "low" when in fact it is high, but if we employ a strict position-weighting discipline, we would sell some of our position when the stock moves a bit higher, and buy back a portion when it falls back to the original price. We can profit even if we are partially long all the time. In this very bad pivot choice scenario, our scheme would become, "buy high, sell higher, and then buy back lower." With time, and the more we trade against the movements, our average buying price should become lower and lower even though we started by actually buying "high."
What I'm trying to say here, is that as long as the buy/sells are relative and inverse to the movement of the asset, we should be able to beat buy-and-hold - even if we have made an extremely sub-optimal choice of a pivot.
Can anything be even worse than picking a sub-optimal pivot? Yes: a worst case scenario would be to buy an asset that keeps dropping and dropping until it reaches zero and never comes back (e.g. a company going out of business), but in this case, the buy and hold approach would fare even worse. In the buy and hold scenario, our loss would be 100% of our initial investment in this particular asset. In the contrarian trading case, if we sold every time the asset temporarily spiked up, and partially increased our position when it went down again, some of our gains along the way would partially offset our overall loss. Trading against the movements generates cash regardless of where the asset eventually ends up. This makes it obvious that no matter what we do, we should always maintain a diversified portfolio. Even if one of our asset goes to 0, we still have capital to remain in the game.
One additional risk-averting condition we may impose on ourselves is a limit on each single position. e.g. we never go above a 200%/N position, where N is the total number of assets we trade, no matter how many standard deviations below our pivot the price falls to.
Some better pivot lines can be:
- A simple or exponential moving average of the asset with period=N
- A Fourier-transform approximation - extrapolated slightly
- A LOESS line approximation - extrapolated slightly
In all cases we keep recalculating the pivot line continuously so it keeps using all recent information and doesn't totally diverge from reality over time. This is also why the very distant past is probably not very useful. In all the smoothing methods, the more points we add at the right end (present), the less relevant the points on the far left (past) become.
Here are some charts of ETFs with relatively high volatility and periodicity, that look like they should be good candidates for a high-turnover short-term trading contrarian strategy. These examples were selected based on the fact that their long term trends are (at the time of this writing) up. When long-term trends change, we should, of course, pick different ETFs.
First is SFK, the ProShares Ultra (double) short financial ETF, with the near optimal (but optimistic) LOESS pivot line. LOESS is a really good pivot that crosses the chart nicely close to the mid point of major moves, but is impractical because the algorithm 'peeks' into future points:

Second is SSG, the ProShares UltraShort Semiconductors, Again, this is a short ETF which moves up as the Semiconductors sector moves down. For the interested how this is done, this ETF is mostly in cash but is also holding a certain percentage of its assets in multiple-period puts/future-contracts on Semiconductor companies, expecting the companies to go down, and thus expecting their put-contracts to go up. It is designed to move: y = -2x (double the inverse) on any daily change x in the Semiconductor sector index.
This time we generate our pivot with a Fourier-transform (5 top coefficients). Fourier is a powerful technique to accurately capture the dominant frequencies of a series. What we can see here is that SSG has been a wonderful ETF to be holding during the recent bear market as its direction is generally up.
We can also see that as of the time on this writing, (Sept 6, 2008), SSG has reached an extreme spike and is due for a pull-back. Our pivot makes it clear that we are now at the point of "maximum danger" and should strongly consider closing positions in this (short) ETF completely.

Third, is a chart of UKK, the ProShares Ultra Russell 2000 Growth ETF, with multiple Exponential Moving Average pivot lines. This is not a good choice right now (the exception that proves the rule). We can see that EMA100 (the blue line) is very weak since it doesn't follow the chart closely. In this particular case, where the ETF is extremely volatile, the best pivot seems to be the fast 5-day EMA line (black). If you have nerves of steel, and can afford to hold a losing position that's moving against you for 20-30 days and not flinch, even the 50 day EMA (green) may ultimately prove profitable but you have to hold on to your conviction that this method works most of the time.
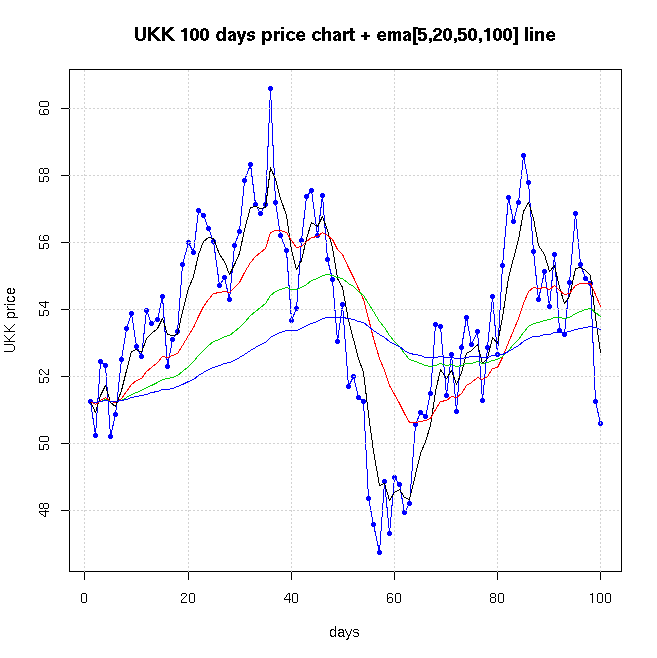
Perhaps the most remarkable fact about the last chart is that even though EMA lines are calculated only based on the past and not on the future, the underlying asset crosses the EMA lines on a pretty regular basis. Each and every EMA line in the above chart has roughly half of the price points above it and half below it. The shorter the EMA period is, the closer we get to about a 0.5 ratio. The reason is simple, the asset moves much faster than the EMA, the reversion to the mean force keeps pulling it back towards the EMA pivot lines whenever it strays away for too long.
Also notice that the longer the EMA period is, the less often the price of the asset crosses it. There's a trade-off between choosing a short period EMA and a long period EMA for the pivot: if the period is too short, the pivot moves too much "chasing" the asset, thereby losing the property of a stable leverage. A reference point that's not stable, isn't really a reference point. On the other hand, if the period is too long, the pivot doesn't move much vertically. As a result of the pivot being too 'stable' we may find ourselves too far from the asset for long periods of time without enough opportunities to trade often on the mean reversion. The key question, of course, is which period is optimal.
Here are some more experiments I've done with a Fourier-transform pivot
Asset Allocation Redux
It follows that the choice of an optimal pivot has a lot to do with how active we want to get: if we want to trade only once a year or so, we can just pick longer term EMAs.
Assume that we follow 8 separate pivots of 8 relatively uncorrelated assets in an active portfolio. Now assume we use some long-term period to implement our position adjustment. Does this sound familiar?
Some people call this long-term, low activity methodology, "Strategic asset allocation", or "rebalancing once a year".
What we are doing here is exactly that, except on much shorter time periods. In asset allocation, investors target predetermined percentages and rebalance (sell winners, buy losers) periodically. Here our target is "the pivot" and we readjust (rebalance) our position whenever our rules trigger a trade. The trigger can be 'strategic' i.e. based on time; once a day, once a week, or it can be 'tactical': when the vertical distance between the current price and the pivot exceeds X%, Y standard-deviations, etc.
If our thesis is correct, and we pick a good pivot, the difference in performance though should be dramatic because the frequent adjustments -- as opposed to a once a year rebalancing -- keep adding up.
Tactical adjusting with Bollinger Bands
Bollinger bands are bands that lie N-standard deviations above and below some smoothed moving-average of an asset price.I've modified some free R code (thank you, Dirk Eddelbuettel) to plot ETFs with:
- A smoothed N-day SMA pivot line in pink. By default this is the 10-weeks (50 trading days) SMA of the daily closing price. It is a pretty good pivot.
- Light blue lines 1 Std-Dev above/below the pivot
- A red line 2 Std-Devs above the pivot line.
- A green line 2 Std-Devs below the pivot line.
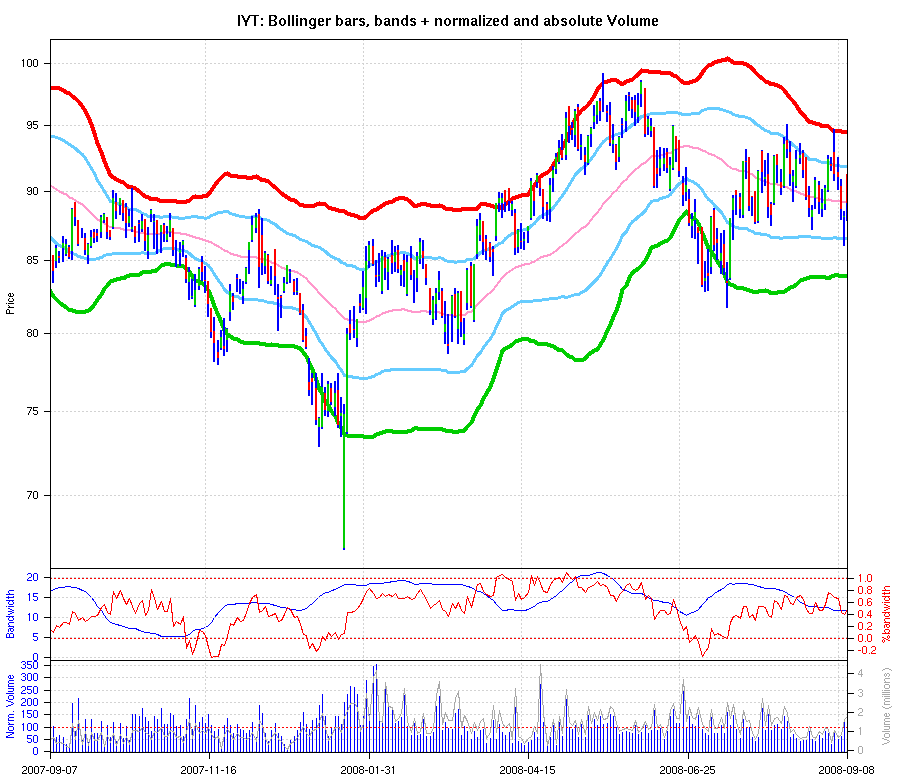
Here's an example of IYT, the iShares Dow Jones Transports ETF chart, over the past 1 year (252 trading days) with Bollinger Bands
And here SPY, the SPDRs S&500 ETF, chart:
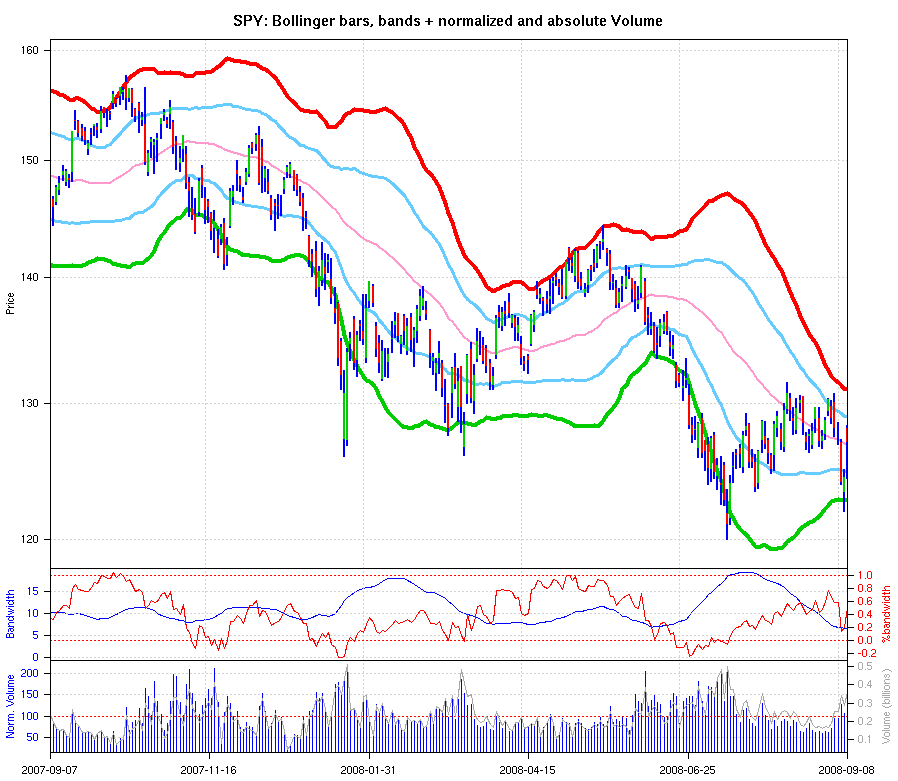
You can see that most movements are pretty much bounded by the 2-SD lines. Whenever there's an extreme piercing of the green line (like mid day Jan 22 and 23, 2008) it is usually an exceptional opportunity to increase positions to the max, and hold for a few weeks. The charts above show a few more critical items we can easily exploit in out model:
- During bear markets (when the long term trend is down) the price tends to bump much more often against the green line than against the red line. In this case, we want to be more careful and buy less aggressively on the red-bumping than in bull-markets. We'll see exactly how in the next section: the optimal Position sub-problem.
- Whenever an asset trends up for a prolonged period, it tends to move in an upper Bollinger-band channel. Conversely, down-trending assets tend to run inside lower Bollinger-band channels. In such cases we want to adjust to a shorter term pivot. After all our goal is to have the asset cross our pivot often.
- Normalized volume spikes at both extremes (lows and highs) as the "smarter" money moves in and out ahead of the short-term moves.
- The "bandwidth" sub-chart is another great contrarian indicator. When the red line (price location as a percentage of the overall width of the Bollinger band) is at its lowest-end and the band-width is highest-end usually marks an intermediate bottom.
TODO: we should go further.  My time is short... Perhaps later.
Topics I should still cover:
    - Picking optimal periods for smoothing based on:
	- N-day autocorrelations
	- Averaging multiple short-term moving-averages
    - Modeling for optimal pivots using SVM and data visualization
    - Some real simulations (back-tests) with results
The Optimal Position sub-problem
Intro Case Pivot Position Simulation
Disclaimer: this should not be considered as investment advice. It is merely describing my own thoughts and actions.
Feedback is welcome.
-- ariel